Cooperative Urban Mobility Portal
Explore Connected and Cooperative Mobility
C-ITS Services
Introduction
Green Priority (GP) aims to change the traffic signals status in the path of an emergency or high priority vehicle (e.g., public transport vehicles), halting conflicting traffic and allowing the vehicle right-of-way, to help reduce response times and enhance traffic safety. This service is also known as “Traffic signal priority request by designated vehicles” or “Priority Request”. Different levels of priority can be applied, e.g. extension or termination of current phase to switch to the required phase. The appropriate level of green priority depends on vehicle characteristics, such as type (e.g. HGV or emergency vehicle) or status (e.g., public transport vehicle on-time or behind schedule). The vehicles request priority for an intersection, and the traffic light controller determines in what way it can and will respond to the request.
Your content goes here. Edit or remove this text inline or in the module Content settings. You can also style every aspect of this content in the module Design settings and even apply custom CSS to this text in the module Advanced settings.
Methodology and data flow

The process starts when the user uses the Personal Information Device (PID), i.e. the unit that will show the information and carry out the communication. From the moment that unit is started, the logging process is initiated.
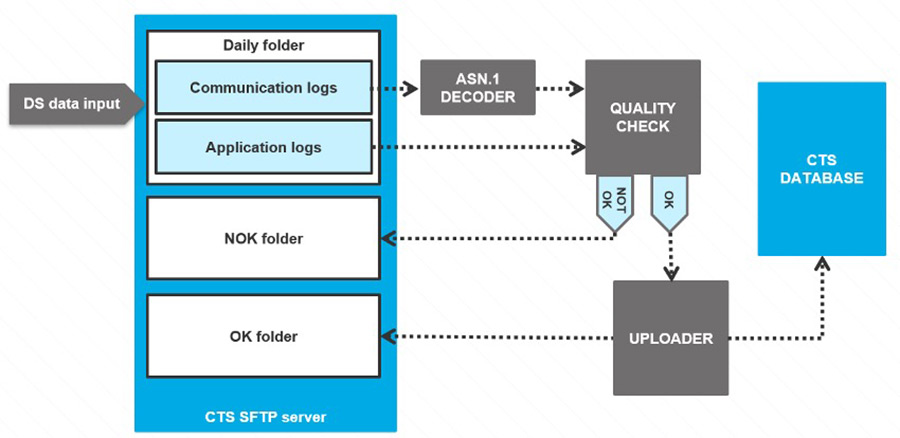
There are two different types of logging: the communication logging and the application logging. The former consists on the messages that the unit sends and receives (called communication logging, encoded on asn.1 and hence, not directly readable) and the latter the information about the events (called application logging). Each message and event type have an own file, and only the messages and the information surrounding an event are logged for privacy and performance purposes.
Those files are uploaded to a central server via SFTP (a file transfer protocol based on SSH) and stored for each Deployment Site individually. The communication logs are decoded and then, together with the application logs, are brought under a Quality Check process to discard the information with errors. Last but not least, the correct logs are uploaded to a Central Database, where all the information of all Deployment Sites are present. This process can be observed in Figure 2.


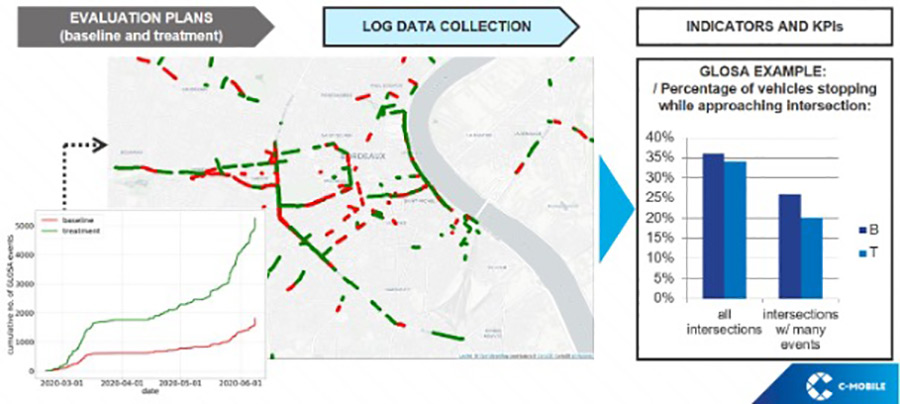
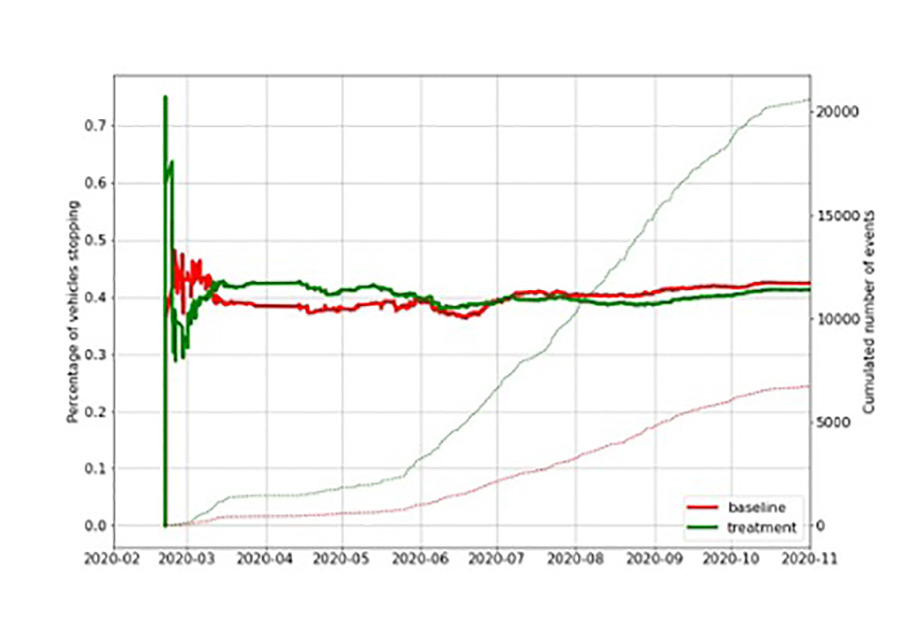
As an example, one KPI relevant for the GLOSA service might be the “Percentage of vehicles passing the intersection without stopping”. The comparison of KPIs from Baseline and Treatment data reveals the real-life impact of the service on the traffic flow.


This website has received funding from the European Union’s Horizon 2020 Research and Innovation Programme
under Grant Agreement number 723311.
