Cooperative Urban
Mobility Portal
Explore Connected and Cooperative Mobility

Cooperative
Urban Mobility Portal
Explore Connected and Cooperative Mobility
Blind Spot Detection (BSD)
Emergency Vehicle Warning (EVW)
Flexible Infrastructure (FI)
Green Light Optimal Speed Advisory (GLOSA)
Green Priority (GP)
In-Vehicle Signage (IVS)
Motorcycle Approaching Indication (MAI)
Road Hazard Warning (RHW)
Road Works Working (RWW)
Signal Violation Warning (SVW)
Warning System for Pedestrian (WSP)
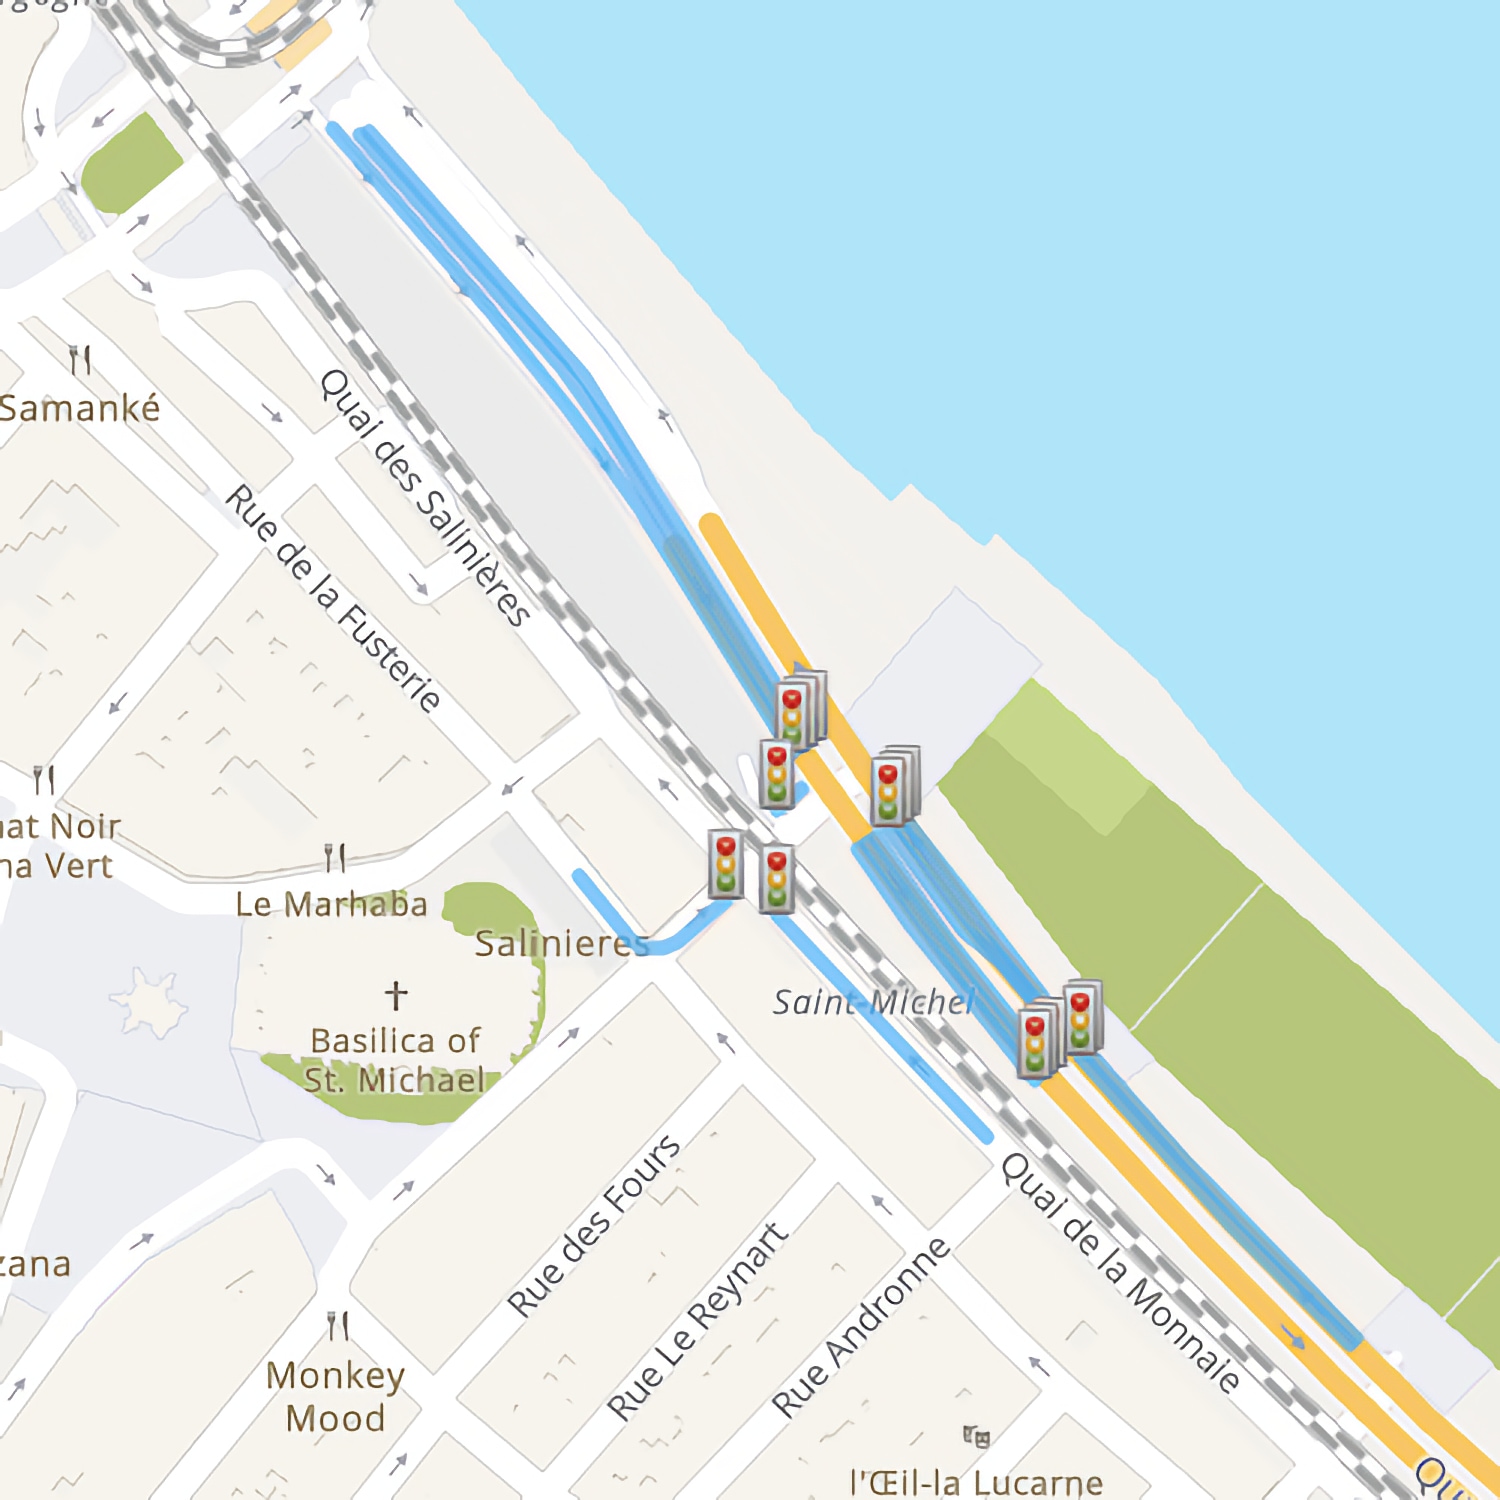
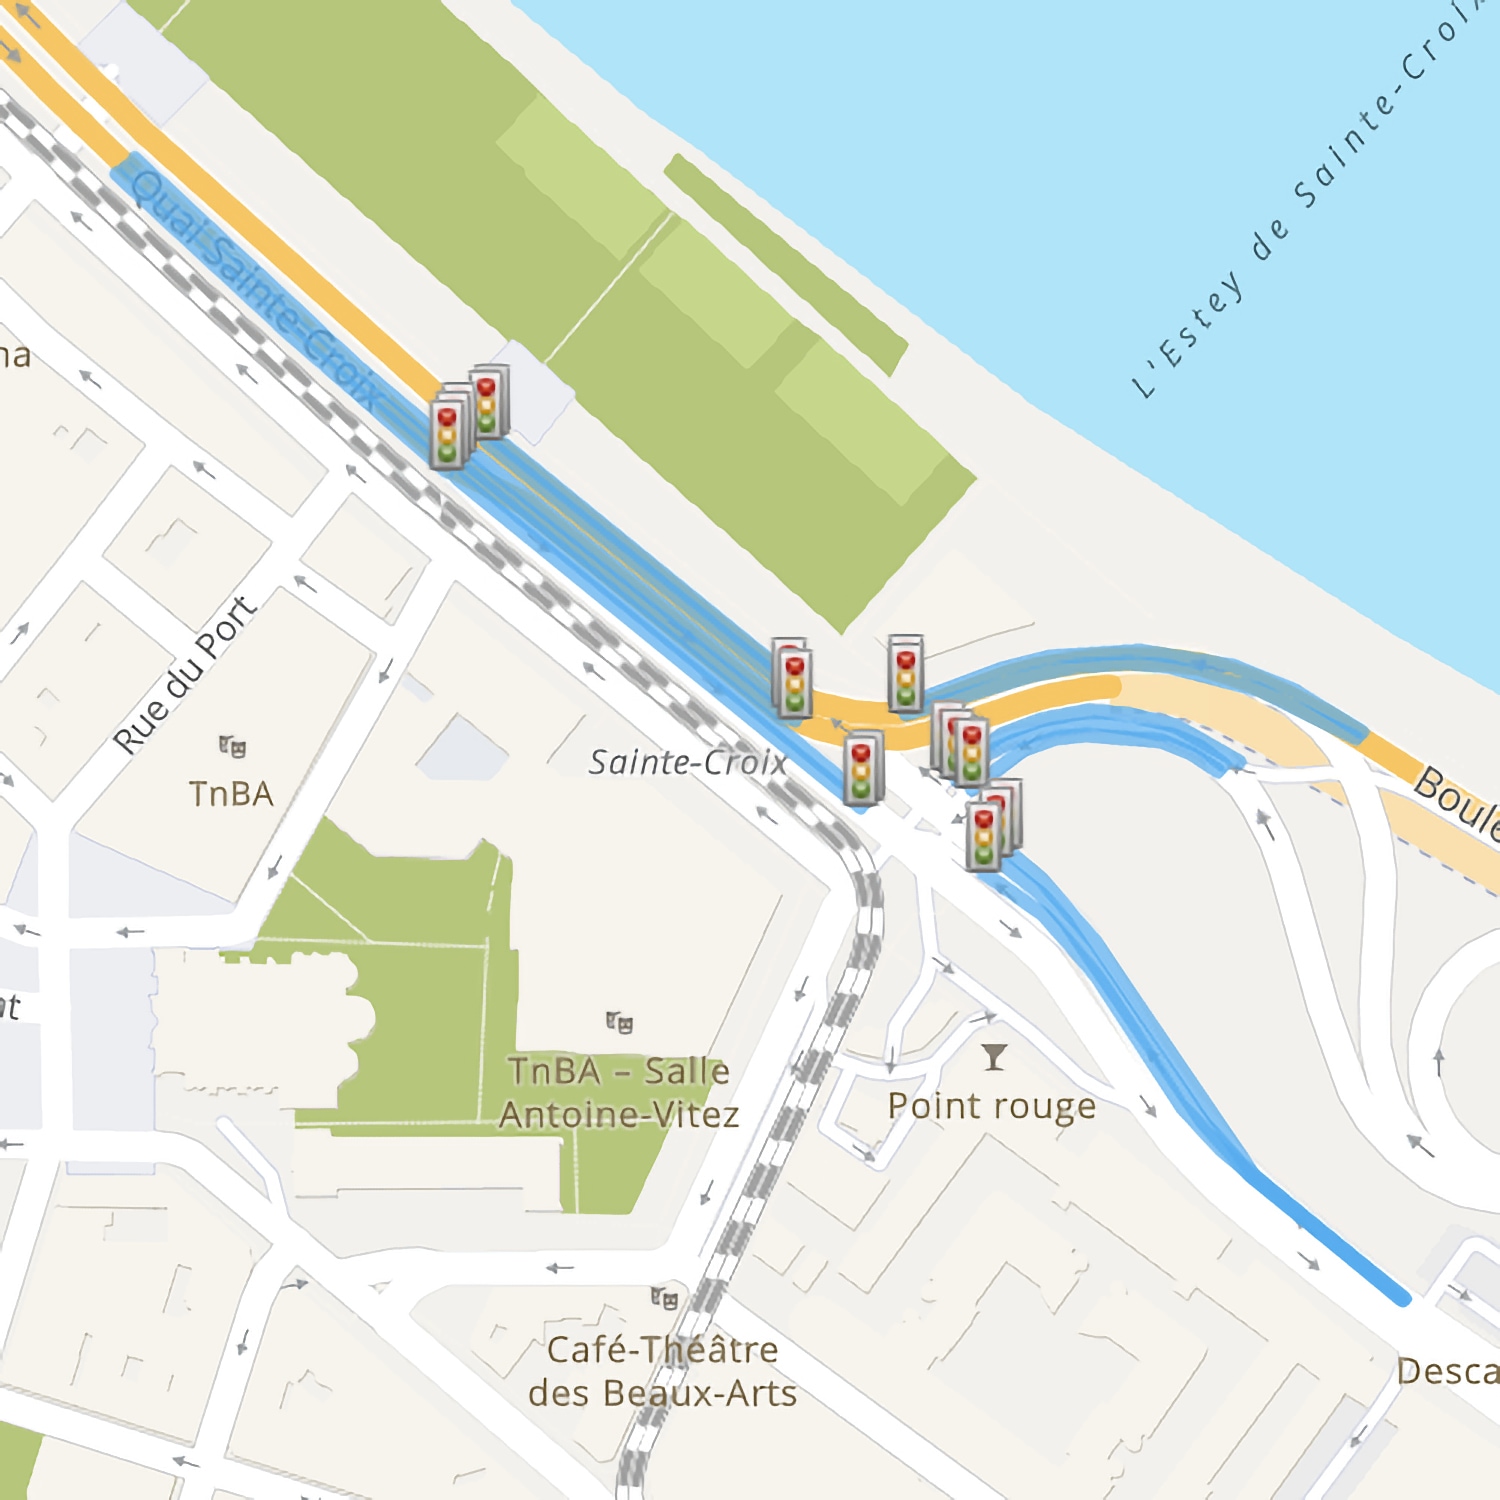
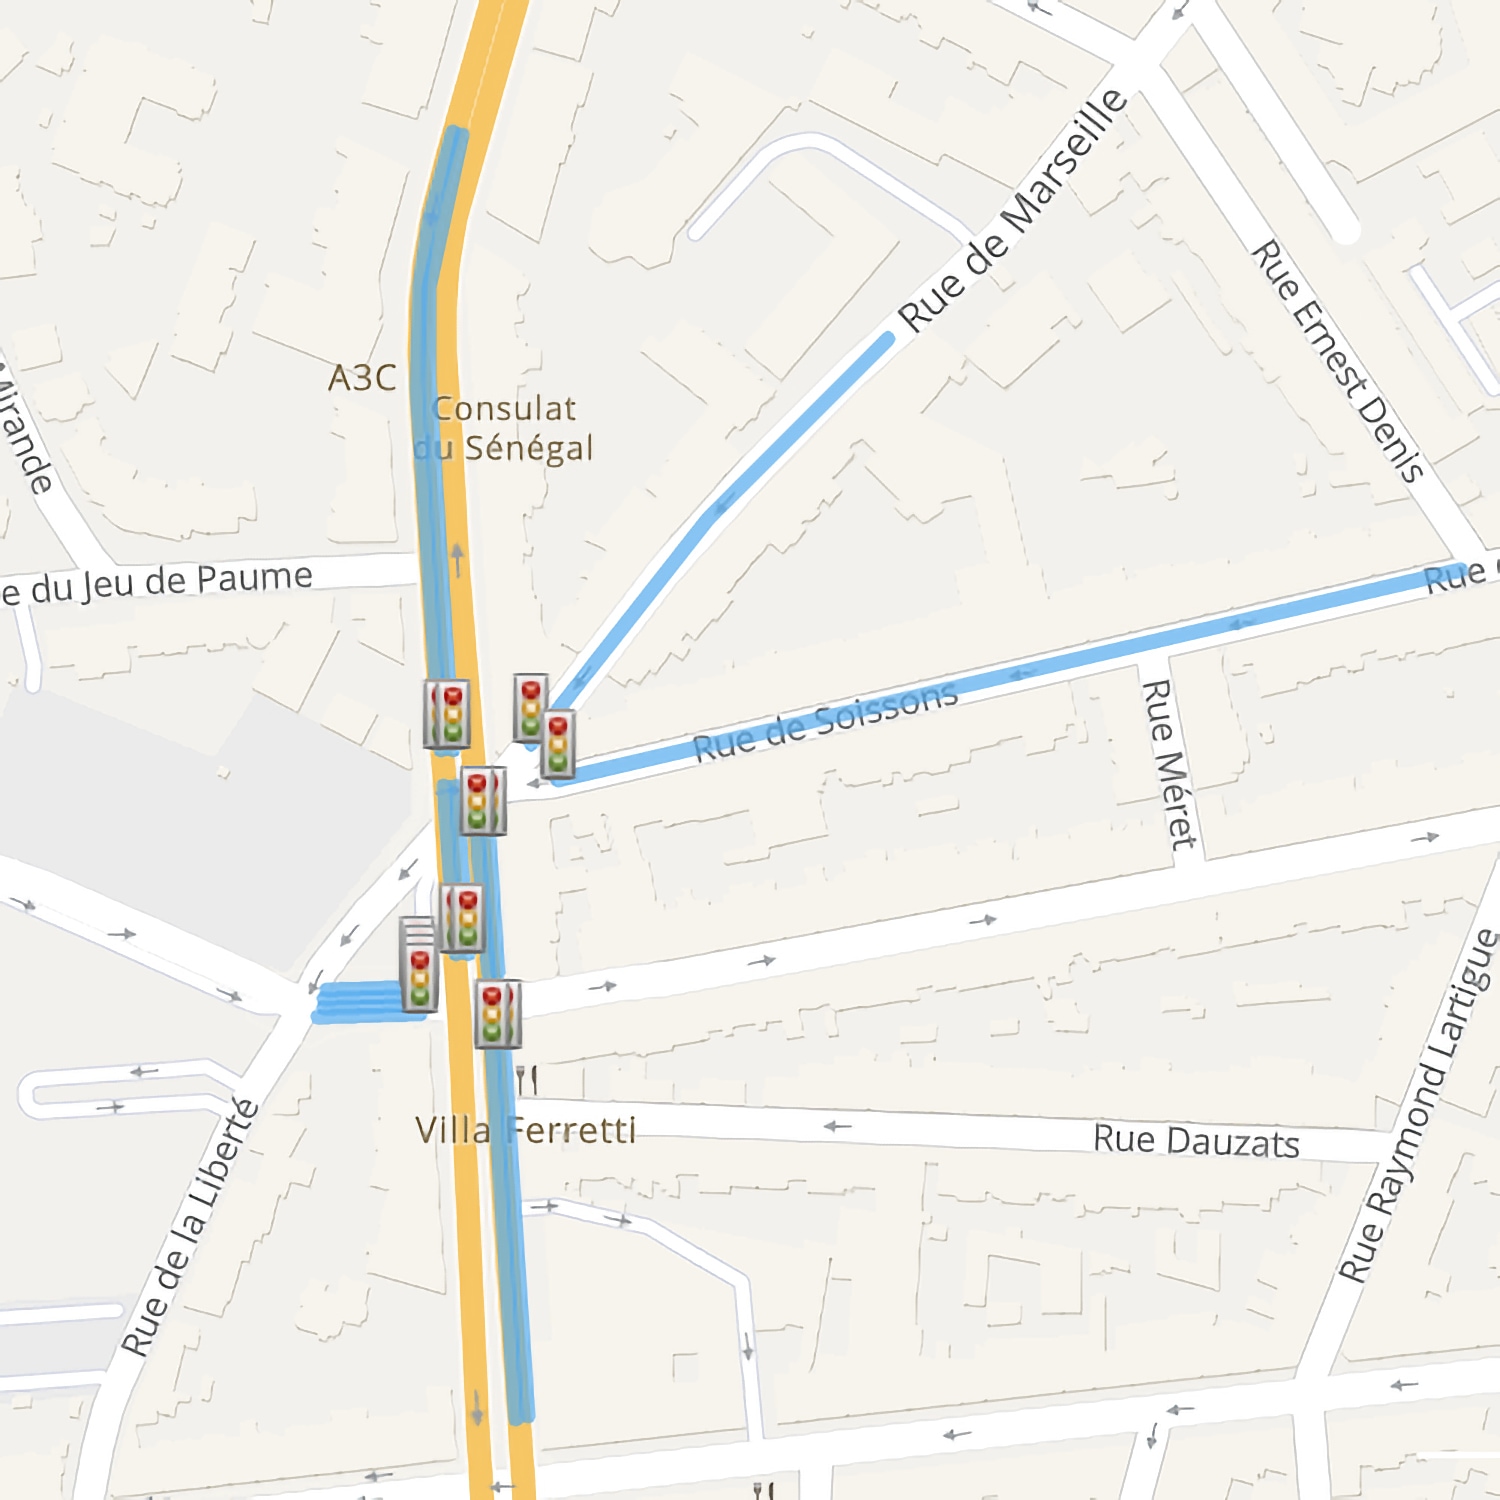
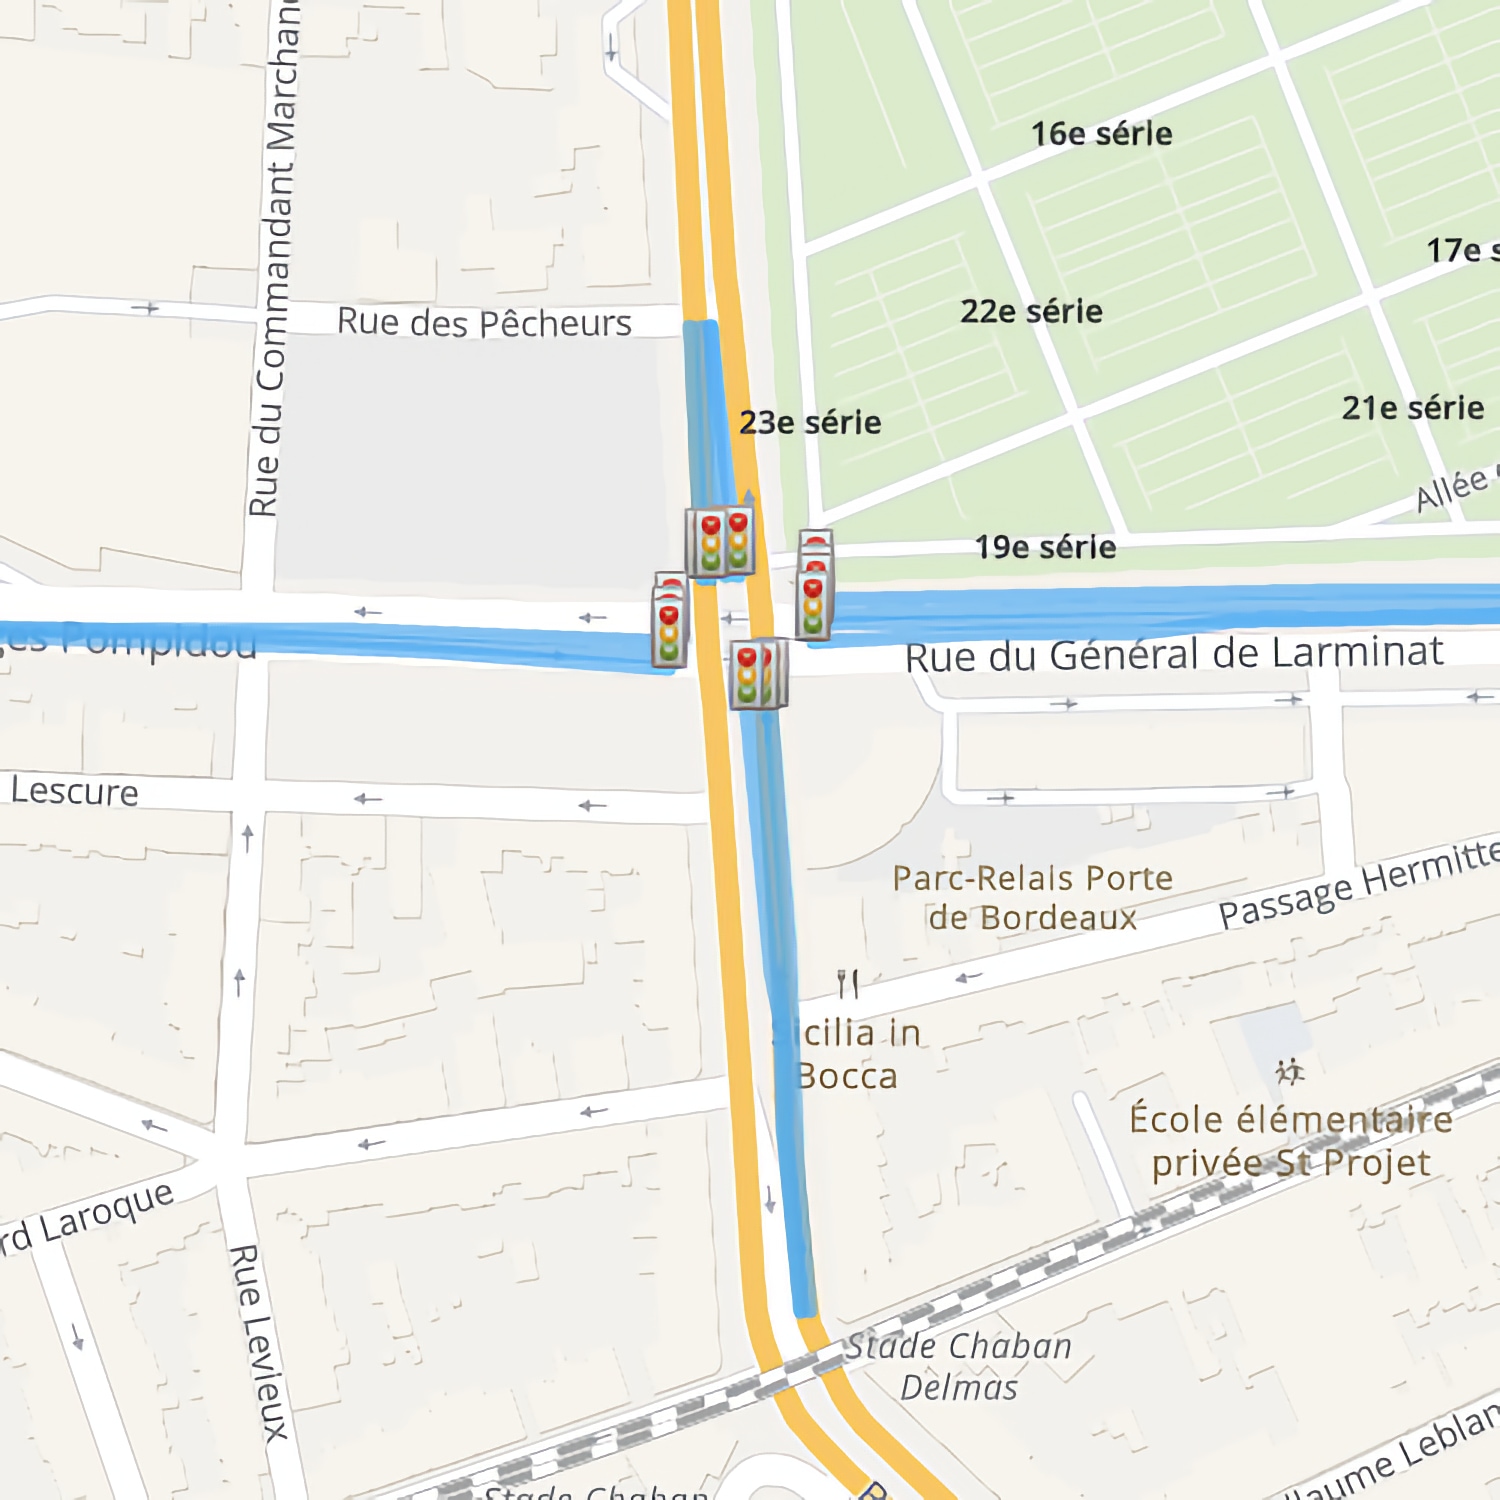
GLOSA in Bordeaux
Bordeaux has a lot of traffic light intersections which are used daily by a high number of drivers, causing congestion and pollution. GLOSA was deployed on around 600 intersection in order to have the best possible impact. The following results describe the GLOSA analysis on the 5 most used intersections in Bordeaux.

For the evaluation of the GLOSA deployment in Bordeaux, the relevant log items are the tlmaction, tlmevent and CAM log files. All of these log files are automatically recorded by the PID of the user. The tlmevent logs contain the basic information for each event (e.g. timestamp, log_stationid, intersectionid etc.). The tlmaction logs contain the status of the HMI and thus record the information that was presented to the driver at each moment in time with a frequency of approximately 1Hz. Relevant fields include the speed advice (if shown), the current and next signal phase and the distance to the stop line. The CAM logging is mainly used to derive the vehicle position, speed and acceleration for the entire duration of the event, also at a frequency of approximately 1Hz. For a more in-depth description of the logging format and the data fields in each log type please visit Open Common Log Data Format.
The example data set provided here consists of all GLOSA events logged in the intersections listed above. The data set includes both baseline and treatment events. ‘Baseline’ indicates that the service was not active (no information was presented to the driver) and is used as a point of reference, whereas ‘treatment’ events are logged when the service is fully functional. Separating events by baseline/treatment is possible by analyzing the content of the tlmaction log files and, more specifically, by checking for the existence of rows where eventmodelid==6 (indicating that certain information was displayed on the screen). The NeoGLS app deployed in Bordeaux randomly switches between baseline/treatment with pre-defined probabilities (percentage of baseline events was 25% at the start of the deployment and 15% later on). Therefore, the example data set consists of roughly 80% treatment events and 20% baseline events.
To simplify the provision and processing of data, all tlmaction logs are grouped into one tlmaction.csv file, all tlmevent logs into one tlmevent.csv file and all CAM logs into one CAM.csv file.
You can download the log data here.

Evaluation Results
Several indicators can be used to evaluate the impact of GLOSA on the traffic flow in terms of safety and efficiency. The following table briefly describes some of the main indicators. GLOSA is expected to have an impact on both the efficiency and the safety of traffic. It is expected to decrease the number of stops while approaching the intersections, since drivers should gradually slow down well before a red light. This will also increase the maximum deceleration (less hard braking expected) and decrease the maximum acceleration (which mostly occurs from standstill after a stop).
| Short name | Long name | Description | Expected effect |
| numberofstops | Number of stops | How many times does the vehicle stop during the event (intersection approach and passage) | decrease |
| meanspeed | Mean speed | The mean speed of the vehicle during the event | decrease |
| speedvariance | Speed variance | Standard deviation of the speed of one vehicle during the event | decrease |
| maxdeceleration | Maximum deceleration | The maximum deceleration (braking intensity) of the vehicle during the event | increase |
| maxacceleration | Maximum acceleration | The maximum acceleration of the vehicle during the event | decrease |
| … | … | … |
The evaluation results data set provided here also contains a table with the above-mentioned indicators calculated for each event. The overall impact of GLOSA can then be calculated by grouping events by baseline/treatment and comparing the indicator averages over both groups. The following table gives an overview of the main indicators as extracted from the sample data for one intersection (intersectionid = 110). The results based on the sample data indicate that, when using the service, the average number of stops decreases by 14%, which is positive in terms of the efficiency. The speed variance within events also decreases by almost 20%. However, in this example the maximum deceleration also increases by 13%, indicating that in this intersection the service does not have a significant impact on traffic safety.
| Indicator | Baseline mean (n=179) |
Treatment mean (n=711) |
Percentage difference |
| maxdeceleration | -1.07 | -1.21 | -13 % |
| maxacceleration | 1.63 | 1.39 | -15% |
| numberofstops | 0.36 | 0.31 | -14% |
| speedvariance | 124.44 | 100.5 | -19% |
| meanspeed | 34.37 | 34.23 | -0% |
| … | … | … |
To better understand and evaluate these indicators, the mean values are not enough. The probability density functions (PDF) of the indicators for baseline and treatment should also be considered. The following figure illustrates this concept for two of the indicators. Although there is a clear difference in the mean values between baseline and treatment, the relatively widely dispersed distributions and high standard deviation values suggest that the impact of the service is still uncertain.

In order to have more robust and meaningful evaluation results, a larger data sample and a more in-depth analysis of the data (e.g. filtering events by certain criteria, taking into consideration peak/off-peak traffic conditions, checking for incomplete events or errors in the log data etc.) is required. For further details on this please consult <add link to D6.4 (when it will be published)>.
You can download the evaluation data here.
Blind Spot Detection (BSD)
Emergency Vehicle Warning (EVW)
Flexible Infrastructure (FI)
Green Light Optimal Speed Advisory (GLOSA)
Green Priority (GP)
In-Vehicle Signage (IVS)
Motorcycle Approaching Indication (MAI)
Road Hazard Warning (RHW)
Road Works Working (RWW)
Signal Violation Warning (SVW)
Warning System for Pedestrian (WSP)
This website has received funding from the European Union’s Horizon 2020 Research and Innovation Programme
under Grant Agreement number 723311.