Cooperative Urban
Mobility Portal
Explore Connected and Cooperative Mobility

Cooperative
Urban Mobility Portal
Explore Connected and Cooperative Mobility
Blind Spot Detection (BSD)
Emergency Vehicle Warning (EVW)
Flexible Infrastructure (FI)
Green Light Optimal Speed Advisory (GLOSA)
Green Priority (GP)
In-Vehicle Signage (IVS)
Motorcycle Approaching Indication (MAI)
Road Hazard Warning (RHW)
Road Works Working (RWW)
Signal Violation Warning (SVW)
Warning System for Pedestrian (WSP)
RWW in Vigo
The city of Vigo has been gradually increasing and developing strategies for the improvement and optimization of urban mobility. Due to improvements in infrastructures, road and roadway, several works are being carried out in strategic points of the city.

The RWW service makes it possible to identify the points where road works are being carried out and allows users optimising their routes and moving around more safely.

Sample Data Description
For RWW service, the necessary data is allocated in the denmevent, denmaction and CAM logging (as it’s a service based in DENM and CAM contain all the information about the vehicle). This logging is carried out by the user’s PID.
For the sake of simplicity, all the events are grouped in three files, the denmevent, demaction and CAM files, which contain the denmevent, denmaction and CAM data, respectively. All the data has been recorded at 1 Hz frequency, excepting a period in which the CAM data was being recorded at 0.5 Hz.
Each singular event can be discerned selecting different (log_stationid, eventid) combinations. Each of them should begin with the (eventmodelid, eventactionid) pair being (5, 1) and sould end with a (eventmodelid, eventactionid) pair being (5, 3). If there are entries with eventmodelid=6 in the event, it means that the event was in treatment mode (i.e: the information was presented to the user), if that is not the case, the event was in baseline and the information was not presented.
The most important fields are on the denmevent file, they can be observed in the following table.
Example of table/list with relevant indicators:
| Short name | Long name | Description |
| originatingstationid | Stationid of the event’s creator | This is the stationid of the unit that created the event, it’s extracted from the DENM. |
| sequencenumber | Sequence number of the message | The sequence number of the DENM, used to link the event to the message. |
| eventcausecode | Cause code of the event | The cause code is used to know which kind of event it is. For RWW, eventcausecode = 3. |
| eventsubcausecode | Sub-cause code of the event | The sub-type of the event. As there are no sub-types for RWW in Vigo, eventsubcausecode = 0. |
You can download the log data here.
Evaluation Results
There are several indicators to evaluate the performance of RHW service. The most important ones are related to the speed and acceleration profiles of the user. In the evaluation file a table can be observed with the results for each event. In the following table some of these indicators are explained.
Example of table/list with relevant indicators:
| Short name | Long name | Unit | Description | Expected effect |
| meanspeed | Mean speed | km/h | The mean speed of the vehicle during the event | decrease |
| speedstdev | Speed variance | km/h | Standard deviation of the speed of one vehicle during the event | decrease |
| maxdeceleration | Maximum deceleration | m/s^2 | The maximum deceleration (braking intensity) of the vehicle during the event | increase |
| maxacceleration | Maximum acceleration | m/s^2 | The maximum acceleration of the vehicle during the event | decrease |
| … | … | … |
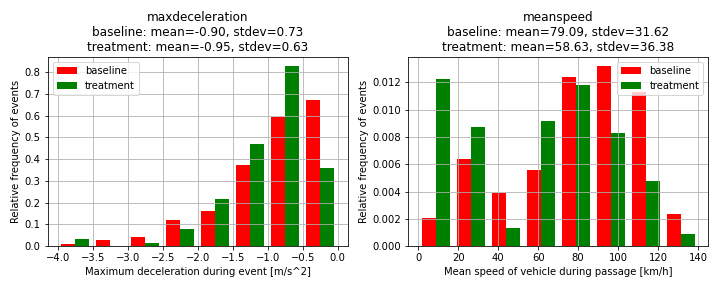
The overall impact of RWW can then be calculated by grouping events by baseline/treatment and comparing the indicator averages over both groups. The following table gives an overview of the main indicators as extracted from the sample data. Maximum deceleration values and the frequency of hard braking seem to increase when using the service. The mean speed also decreases, but this might be a direct consequence of the initial speed also being lower in treatment events. The percentage speed 5 seconds after the first HMI notification is slightly lower than 1 in treatment, showing that drivers slightly reduce their speed in response to the information about the road works situation.
| Indicator | Baseline mean (n=411) |
Treatment mean (n=131) |
Percentage difference |
| maxdeceleration | -0.90 | -0.95 | -6% |
| ishardbraking | 1.0% | 1.5% | +57% |
| meanspeed | 79.09 | 58.93 | -26% |
| maxspeed | 91.95 | 71.68 | -22% |
| initialspeed | 77.33 | 58.03 | -25% |
| Percspeed_5 | 1.05 | 0.97 | -8% |
| … | … | … |
To better understand and evaluate these indicators, the mean values are not enough. The probability density functions (PDF) of the indicators for baseline and treatment should also be considered. The following figure illustrates this concept for two of the indicators. Although there is a clear difference in the mean values between baseline and treatment, the relatively widely dispersed distributions and high standard deviation values suggest that the impact of the service is still uncertain.
In order to have more robust and meaningful evaluation results, a larger data sample and a more in-depth analysis of the data (e.g. filtering events by certain criteria, taking into consideration peak/off-peak traffic conditions, different user groups, checking for incomplete events or errors in the log data etc.) is required. For further details on this please consult <add link to D6.4 (when it will be published)>.
You can download the evaluation data here.
Blind Spot Detection (BSD)
Emergency Vehicle Warning (EVW)
Flexible Infrastructure (FI)
Green Light Optimal Speed Advisory (GLOSA)
Green Priority (GP)
In-Vehicle Signage (IVS)
Motorcycle Approaching Indication (MAI)
Road Hazard Warning (RHW)
Road Works Working (RWW)
Signal Violation Warning (SVW)
Warning System for Pedestrian (WSP)
This website has received funding from the European Union’s Horizon 2020 Research and Innovation Programme
under Grant Agreement number 723311.