Cooperative Urban
Mobility Portal
Explore Connected and Cooperative Mobility

Cooperative
Urban Mobility Portal
Explore Connected and Cooperative Mobility
Tools
CERTH CTMaaS
CTAG ITS Center
IDIADA IDAPT CAV
Infinity Neural TRANSIT
Gertek TrafikOA
Kapsch Connected Vehicles Solutions
Kapsch EcoTrafiX Suite
Macq Mobility Manager
Macq QCAM mobility cameras
NeoGLS Platform
PTV Truck Parking Europe
TNL FlowCube
TNO Automated Data Analysis
TomTom
Automated Data Analysis
ADA, or Automated Data Analysis, is a service for automating the analysis and evaluation of log data during field trials, TESTFESTs, field operational tests and pilot implementations. ADA is developed by TNO and provided as a service to projects and partners on https://ada1.tno.nl/.
Large volumes of log data are collected during the execution of test runs and test drives that need to be uploaded, analysed and reported “immediately” to monitor progress, and to detect and fix issues as soon as possible. There is no point in continued testing and data collection when a service or device fails, or is not used as intended.
Tools developed from many C-ITS and Automated Driving projects are integrated into ADA, from remotely controlled logging and automatic uploading to the reporting of events, indicators and anomalies on a dashboard. ADA accepts log data in the open common log format of C-MobILE.

ADA supports testing and debugging, technical verification, validation and evaluation of systems and devices as well as the functional evaluation and assessment of services and driver compliance. Publications on the use of ADA in for example DRIVE-C2X, InterCor, AUTOPILOT, CONCORDA, 5G-MOBIX are available on the website.
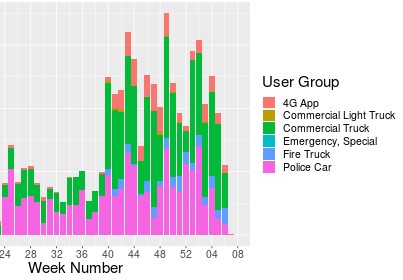
In C-MobILE, ADA has been used to verify the interoperability of systems and services from all Deployment Sites in the TESTFEST held in Vigo, and to monitor and analyse the deployment of Green Priority and GLOSA services in the North Brabant deployment site. The dashboard provides for example overviews of events to monitor the deployment progress, for example for priority requests per user group (next figure), details per intersection, and a drill down to a specific intersection pass, or a series of intersections, to analyse priority requesting and granting, clearing the intersection, vehicle speed and obstructions and delays by other traffic. Indicators are updated daily, for example on the performance of the priority handling by intersections, success rates of requesting, granting and denying priority, delays in priority processing, effects on travel time and response times of emergency vehicles, and decrease in the number of red light crossings by emergency vehicles. Indicators are compared between user groups, response times, red light crossings, obstructions, etc. to assess the effects of priority handling and performance in emergency situations .

Acknowledgements
ADA was developed by TNO. Click here for more information.
CERTH CTMaaS
CTAG ITS Center
IDIADA IDAPT CAV
Infinity Neural TRANSIT
Gertek TrafikOA
Kapsch Connected Vehicles Solutions
Kapsch EcoTrafiX Suite
Macq Mobility Manager
Macq QCAM mobility cameras
NeoGLS Platform
PTV Truck Parking Europe
TNL FlowCube
TNO Automated Data Analysis
TomTom


This website has received funding from the European Union’s Horizon 2020 Research and Innovation Programme
under Grant Agreement number 723311.
