Cooperative Urban
Mobility Portal
Explore Connected and Cooperative Mobility

Cooperative
Urban Mobility Portal
Explore Connected and Cooperative Mobility
Introduction
When deploying C-ITS services (and in general cooperative and connected technologies and digital mobility solutions), it is crucial to evaluate their cumulative, real-life benefits on the surface transport system in terms of traffic management efficiency, traffic safety and environmental impacts. Consequently, the expected positive effects of the C-ITS services are to be substantiated empirically. The evaluation methodology described here has been harmonised and adopted in the frame of the C-MobILE project for a large-scale deployment of C-ITS services in eight cities / regions across Europe referred to as Deployment Sites (DS).
In alignment with the objective of achieving a large-scale deployment, the impact assessment methodology is centred around data collected from users in a naturalistic environment, i.e. tracking the normal, regular and uninfluenced behaviour of users as it is exhibited on a daily basis. For this reason, the data collection needs to be continuous and automatic, which limits the tools and methods available for capturing users’ behaviour. In brief, the impact assessment relies on communication logging and vehicle trajectory data recorded by the devices running the C-ITS services.
As our hypotheses go around the idea that the technology improves the reaction of users, it’s mandatory to differentiate between two types of situations: when the user has no information of the situation (known as baseline) and when the information is presented to the driver (known as treatment).
These situations are called events on the scope of this project and their nature range from a traffic light on a crossing to a road works on the highway. All the study effort is focused on the time surrounding the user passing the event’s location, so it’s of most importance to clearly identify the starting and the ending time of that event. For that reason, a recent logging format, developed by TNO and called Open Common Log Data format, is used. It’s strongly recommended to read the details of that format if the raw data of the project is to be used.
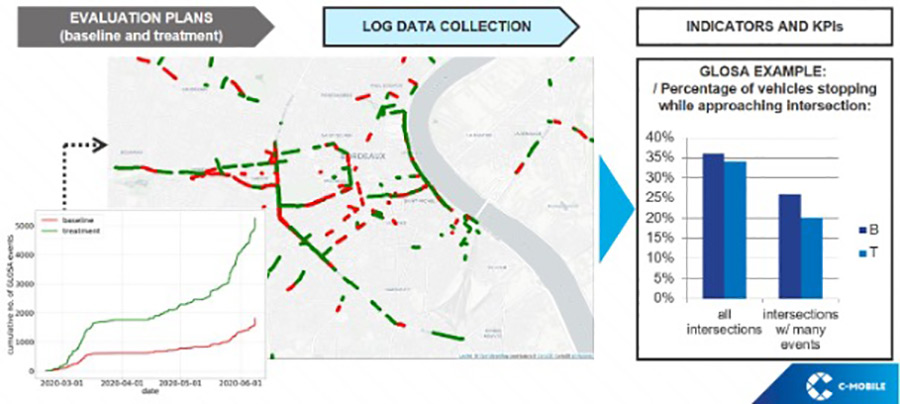
The general approach to evaluate the impact of the C-ITS applications is to observe and compare the behaviour of users in the “Treatment” and “Baseline” scenarios. From the observations at user level, using extrapolations, mathematical models and simulations we derive the expected impact of the services on the transport system as a whole.
Methodology and data flow

The process starts when the user uses the Personal Information Device (PID), i.e. the unit that will show the information and carry out the communication. From the moment that unit is started, the logging process is initiated.
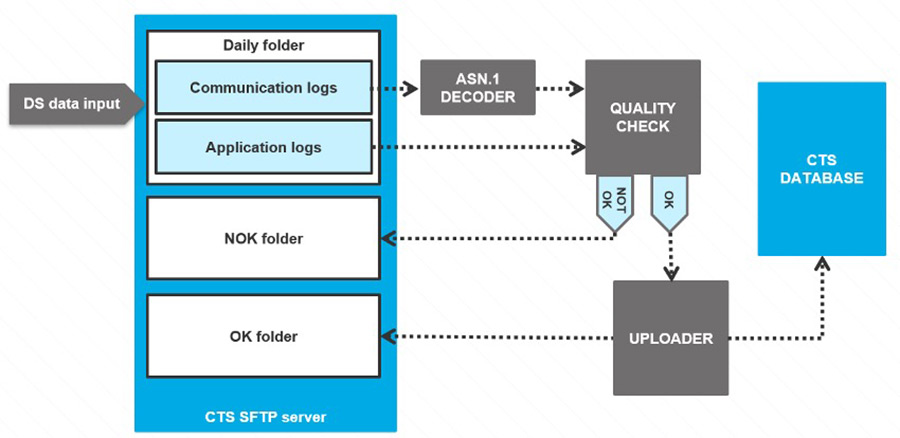
There are two different types of logging: the communication logging and the application logging. The former consists on the messages that the unit sends and receives (called communication logging, encoded on ASN.1 and hence, not directly readable) and the latter the information about the events (called application logging). Each message and event type have its own file, and only the messages and the information surrounding an event are logged for privacy and performance purposes.
Those files are uploaded to a central server via SFTP (a file transfer protocol based on SSH) and stored for each Deployment Site individually. The communication logs are decoded and then, together with the application logs, are brought under a Quality Check process to discard the information with errors. Last but not least, the correct logs are uploaded to a Central CTS Database, where all the information of all Deployment Sites are present. This process is shown in the below image.


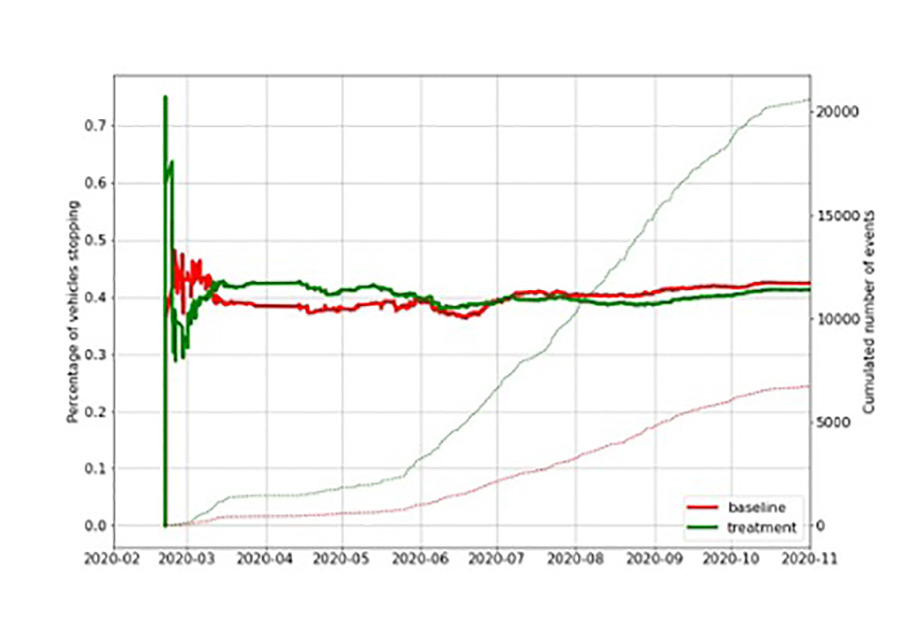
As an example, one KPI relevant for the GLOSA service might be the “Percentage of vehicles passing the intersection without stopping”. The comparison of KPIs from Baseline and Treatment data reveals the real-life impact of the service on the traffic flow.


This website has received funding from the European Union’s Horizon 2020 Research and Innovation Programme
under Grant Agreement number 723311.
