- Blind Spot Detection (BSD)
- Emergency Vehicle Warning (EVW)
- Flexible Infrastructure (FI)
- Green Light Optimal Speed Advisory (GLOSA)
- Green Priority (GP)
- In-Vehicle Signage (IVS)
- Motorcycle Approaching Indication (MAI)
- Road Hazard Warning (RHW)
- Road Works Working (RWW)
- Signal Violation Warning (SVW)
- Warning System for Pedestrian (WSP)
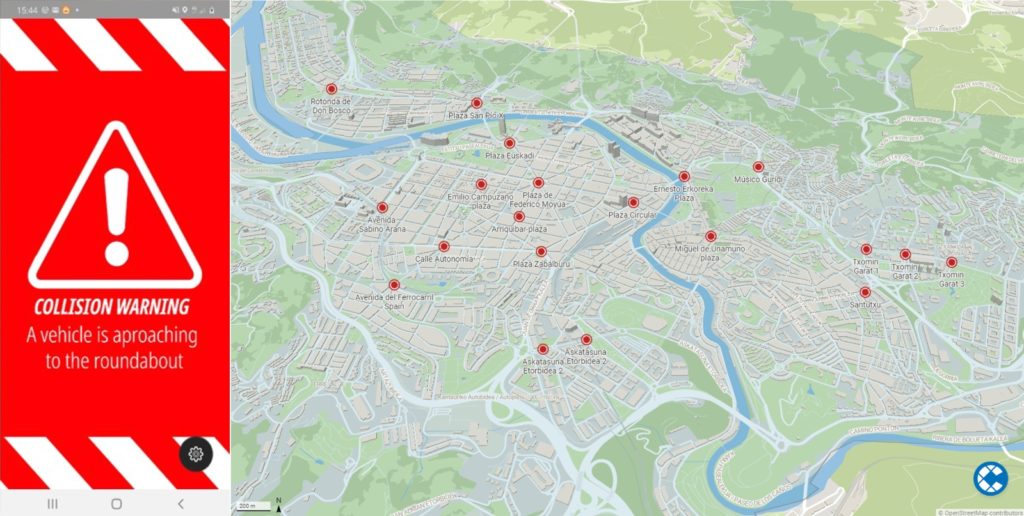
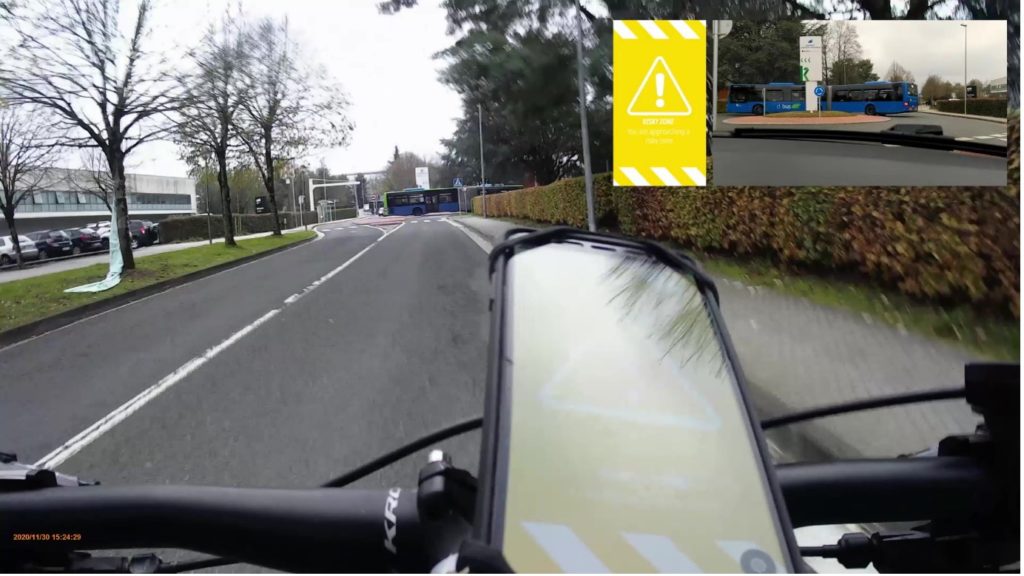
BSD in Bilbao
Bilbao became in 2020 the first city in the world with more than 300,000 inhabitants to limit the speed limit to 30 km/h on all its streets. Therefore, in the last years mobility of other means of transport such as bicycles has been boosted. Cyclists can drive around the whole city but, in some segments, they would share the path with other road users.
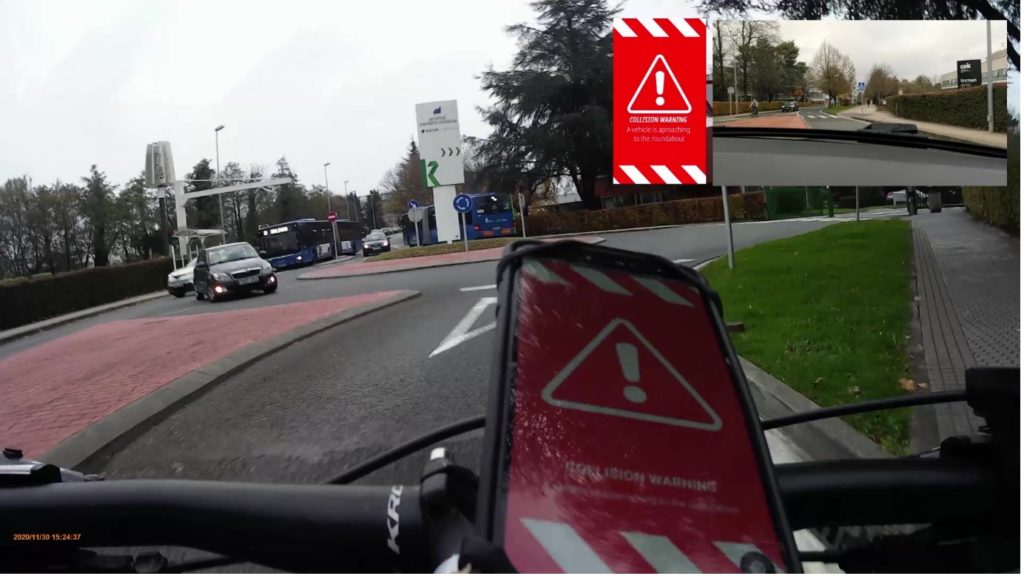
Thus, BSD service will warn the cyclist about the possible collision risk with other vehicles at the surroundings when they are approaching to complex intersection at the city.
Sample Data Description
For the evaluation of the BSD service deployment in Bilbao there are for relevant files logged. The PID of the user automatically records all these log files.
- CAM: contains information about the position and speed of the cyclist.
- DENM: contains the information of the DENM message (encoded in ASN1) that the PID receives
- denmaction: contains the status of the HMI and thus record the information that was presented to the cyclist at each moment.
- denmevent: contain the basic information for each event (e.g., timestamp, log_stationid, eventcausecode etc.)
The frequency of these data (expect from DENM) is approximately 1Hz. The following fields are particularly relevant for the BSD service:
| ShortName | Description |
| Hmipriority | Indicates if the collision risk is imminent because a risky vehicle is near the cyclist (WARNING). or if it just and informative message because of the complexity of the intersection (RELEVANT) |
| Warningdistance | Indicates the distance to the event location |
| Warningsound | Indicates if the application generates vibration and sound patterns for the warning |
| Eventcausecode | This field is set to 97 (collision risk) for the BSD service |
| Eventsubcausecode | Indicates the priority of the warning:
· 0 (unavailable) is set for the low priority warning · 4 (VRU) is set for high priority warning
|
At the denmevent file the evaluator could check the cause codes to confirm which kind of event/service is recorded. The CAM logging is mainly used to derive the vehicle position, speed, and acceleration for the entire duration of the event at a frequency of approximately 1Hz. For a more in-depth description of the logging format and the data fields in each log type please visit Open Common Log Data Format.
The sample data set provided consist of a BSD event logged in Bilbao the XX/XX/XXXX. This dataset includes a treatment data event which is logged when the service is fully functional.
Both CAM and DENM files will contain the original C-ITS message, which need to be decoded to access the whole information. In a deep analysis of this decoded message, we could find for example the field stationType = 2 of the Cam messages, which will confirm that the vehicle that generated this data is a cyclist.
Analysing denmaction and denmevent files we could see that the cyclist will receive a low-priority warning (denmevent codes: 97, 0) when s/he is more than 50 meters away from the collision point. And a high-priority warning (denmevent codes: 97, 4) which includes vibration and sound, when s/he is next to the collision point (<50m).
You can download the log data here.
The example data set provided here consists of all BSD events logged in Bilbao. The data set includes both baseline and treatment events. ‘Baseline’ indicates that the service was not active (no information was presented to the driver) and is used as a point of reference, whereas ‘treatment’ events are logged when the service is fully functional. Separating events by baseline/treatment is possible by analyzing the content of the denmaction log files and, more specifically, by checking for the existence of rows where eventmodelid==6 (indicating that certain information was displayed on the screen). The BSD app deployed in Bilbao randomly switches between baseline/treatment with pre-defined probabilities (percentage of baseline events is 50%). Therefore, the example data set provided here consists of roughly 50 treatment events and 50 baseline events.
To simplify the provision and processing of data, all denmaction logs are grouped into one iviaction.csv file, all denmevent logs into one ivievent.csv file and all CAM logs into one CAM.csv file. Individual events can be identified through unique combinations of the (log_stationid, eventid) fields. As defined in the log format specification, each event should begin with eventmodelid=5 and eventactionid=1 and end with eventmodelid=5 and eventactionid=3. In case there are multiple instances of these combination for one event, the first (5,1) and (5,3) are used to define the start and end of the event.
Evaluation Results
There are several indicators to evaluate the performance of BSD service. The most important ones are related to the speed and acceleration profiles of the cyclist. In the following table, some of these indicators are explained.
| Short name | Long name | Description | Expected effect |
| numberofstops | Number of stops | How many times does the cyclist stop during the event (intersection approach and passage) | decrease |
| meanspeed | Mean speed | The mean speed of the cyclist during the event | decrease |
| speedvariance | Speed variance | Standard deviation of the speed of one cyclist during the event | decrease |
| maxdeceleration | Maximum deceleration | The maximum deceleration (braking intensity) of the cyclist during the event | increase |
| maxacceleration | Maximum acceleration | The maximum acceleration of the cyclist during the event | decrease |
The evaluation results data set provided here also contains a table with the above-mentioned indicators calculated for each event to exemplify the indicator extraction procedure. The overall impact of BSD could be calculated by grouping events by baseline/treatment and comparing the indicator averages over both groups. The following table gives an overview of the main indicators as extracted from the sample data. Due to some errors in the recording of the speed values in the app, the speed values are abnormally low and therefore the indicator values provided here are just for exemplification purposes and do not reflect the real values.
| Indicator | Baseline mean (n=52) |
Treatment mean (n=58) |
Percentage difference |
| maxdeceleration | -0.010 | -0.005 | -47 % |
| maxacceleration | 0.016 | 0.007 | -56% |
| ishardbraking | 0 | 0 | na |
| … | … | … |
You can download the evaluation data here.
EVW in Barcelona
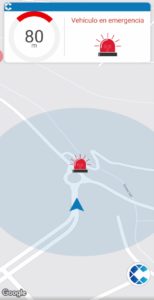
Barcelona firefighters have different stations in the city to optimise their actuations. Still, Barcelona is a busy area and traffic can get challenging for firetrucks in emergency. The Emergency Vehicle Warning service informs road users about emergency vehicles from the fire brigade approaching, even before seeing and hearing them, so that they can anticipate and give way in a safer and more efficient manner.
Sample Data Description
For the evaluation of the EVW service deployment in Barcelona, the relevant log items are the denmaction, denmevent and CAM log files. All of these log files are automatically recorded by the PID of the user. The denmevent logs contain the basic information for each event (e.g. timestamp, log_stationid, eventcausecode etc.). The denmaction logs contain the status of the HMI and thus record the information that was presented to the driver at each moment in time with a frequency of approximately 1Hz. The following fields are particularly relevant for the RWW service:
- Warningdistance: indicating the distance to the event location
- Servicecategorycode: indicating the message displayed on the HMI
- Pictogramcategorycode: indicating the pictogram displayed on the HMI
The eventcausecode field from the denmevent tables, in combination with the servicecategorycode and pictogramcategorycode fields from the denmaction tables, enables the evaluator to differentiate between the different services using the same message types (DENM). The following combinations of values defines the EVW service deployed in Barcelona:
| Service | DENMevent causecode | DENMaction servicecategorycode | DENMaction pictogramcategorycode |
| EVW | == 95 |
The CAM logging is mainly used to derive the vehicle position, speed and acceleration for the entire duration of the event, also at a frequency of approximately 1Hz. For a more in-depth description of the logging format and the data fields in each log type please visit Open Common Log Data Format.
The example data set provided here consists of all EVW events logged in Barcelona. The data set includes both baseline and treatment events. ‘Baseline’ indicates that the service was not active (no information was presented to the driver) and is used as a point of reference, whereas ‘treatment’ events are logged when the service is fully functional. Separating events by baseline/treatment is possible by analyzing the content of the denmaction log files and, more specifically, by checking for the existence of rows where eventmodelid==6 (indicating that certain information was displayed on the screen). The Idiada app deployed in Barcelona randomly switches between baseline/treatment with pre-defined probabilities (percentage of baseline events is 25%). Therefore, the example data set provided here consists of roughly 150 treatment events and 50 baseline events.
To simplify the provision and processing of data, all denmaction logs are grouped into one iviaction.csv file, all denmevent logs into one ivievent.csv file and all CAM logs into one CAM.csv file. Individual events can be identified through unique combinations of the (log_stationid, eventid) fields. As defined in the log format specification, each event should begin with eventmodelid=5 and eventactionid=1 and end with eventmodelid=5 and eventactionid=3. In case there are multiple instances of these combination for one event, the first (5,1) and (5,3) are used to define the start and end of the event.
You can download the log data here.
Evaluation Results
Several indicators can be used to evaluate the impact of EVW on the traffic flow, mainly in terms of safety. The following table briefly describes some of the main indicators. EVW is expected to increase the maximum deceleration (since these are negative values it is a decrease in absolute terms) and the frequency of hard braking, since drivers are informed in advance of the road works and should brake (or at least coast) from further out. Furthermore, the speed variance should also decrease, both within each event and between all vehicle passages.
| Short name | Long name | Unit | Description | Expected effect |
| maxdeceleration | Maximum deceleration | m/s2 | The maximum deceleration (in m/s2) with which the vehicle is breaking during the event. | increase |
| ishardbraking | Hard braking | bool | Bool variable indicating whether there is any deceleration greater than 3 m/s2 | decrease |
| distancetoeventfirstbrakingaction | Distance to the event of the first braking action | m | Indicates the distance to the event (in m) where the first braking has occurred. | increase |
| speedstd | Speed standard deviation | km/h | Standard deviation of speed values during the event | decrease |
| speed_100 | Speed 100m out | km/h | Speed of vehicle at a distance of 100m from the event (warningdistance) | decrease |
| … | … | … | … |
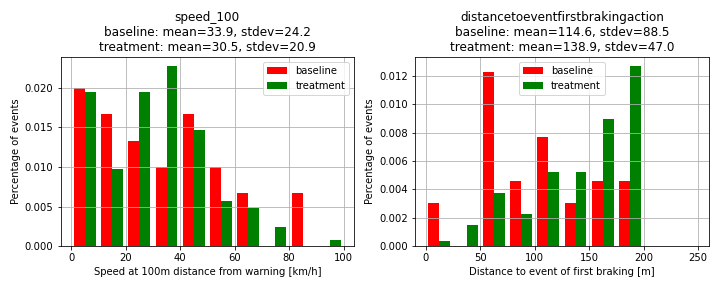
The evaluation results data set provided here also contains a table with the above-mentioned indicators calculated for each event. The overall impact of EVW can then be calculated by grouping events by baseline/treatment and comparing the indicator averages over both groups. The following table gives an overview of the main indicators as extracted from the sample data. The results based on the sample data indicate that, when using the service, there is more hard braking and the maximum deceleration decreases. At the same time, the distance of the first braking from the event increases and the mean speed of the vehicles at 100m distance to the event decreases, which has positive implications on the traffic safety.
| Indicator | Baseline mean (n=43) |
Treatment mean (n=137) |
Percentage difference |
| maxdeceleration | -1.11 | -1.52 | -37 % |
| ishardbraking | 0.02 | 0.04 | +57 % |
| distancetoeventfirstbrakingaction | 114.59 | 138.88 | +21% |
| speedstd | 9.13 | 10.79 | +18% |
| speed_100 | 33.92 | 30.50 | -10% |
| … | … | … |
To better understand and evaluate these indicators, the mean values are not enough. The probability density functions (PDF) of the indicators for baseline and treatment should also be considered. The following figure illustrates this concept for two of the indicators. Although there is a clear difference in the mean values between baseline and treatment, the relatively widely dispersed distributions and high standard deviation values suggest that the impact of the service is still uncertain.
In order to have more robust and meaningful evaluation results, a larger data sample and a more in-depth analysis of the data (e.g. filtering events by certain criteria, taking into consideration peak/off-peak traffic conditions, checking for incomplete events or errors in the log data etc.) is required. For further details on this please consult <add link to D6.4 (when it will be published)>.
You can download the evaluation data here.
FI in Barcelona
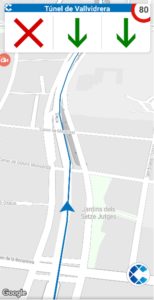
One of the Barcelona’s northern accesses is a tunnel that has a reversible lane which changes depending on traffic demand and direction. The Flexible Infrastructure service informs the users about the reversible lane status in advance, to anticipate their manoeuvres.
Sample Data Description (BCN)
For the evaluation of the Flexible Infrastructure service deployment in Barcelona, the relevant log items are the iviaction, ivievent and CAM log files. All of these log files are automatically recorded by the PID of the user. The ivievent logs contain the basic information for each event (e.g. timestamp, log_stationid, iviidentificationnumber etc.). The iviaction logs contain the status of the HMI and thus record the information that was presented to the driver at each moment in time with a frequency of approximately 1Hz. The following fields are particularly relevant for the Flexible Infrastructure data:
- servicecategorycode (=13), pictogramcategorycode (=659, ‘tidal lane closed’ or 660, ‘tidal lane opened’) to filter the relevant FI events
- Lanenumber: indicating the lane for which the message applies
- Lanestatus: indicating whether the lane is open or closed
- Warningdistance: indicating the distance to the event location
The CAM logging is mainly used to derive the vehicle position, speed and acceleration for the entire duration of the event, also at a frequency of approximately 1Hz. For a more in-depth description of the logging format and the data fields in each log type please visit Open Common Log Data Format.
The example data set provided here consists of all Flexible Infrastructure events logged in Barcelona between 01/10/2020 and 01/04/2021. The data set includes both baseline and treatment events. ‘Baseline’ indicates that the service was not active (no information was presented to the driver) and is used as a point of reference, whereas ‘treatment’ events are logged when the service is fully functional. Separating events by baseline/treatment is possible by analyzing the content of the tlmaction log files and, more specifically, by checking for the existence of rows where eventmodelid==6 (indicating that certain information was displayed on the screen). The Idiada app deployed in Barcelona randomly switches between baseline/treatment with pre-defined probabilities (percentage of baseline events is 25%). Therefore, the example data set provided here consists of roughly 280 treatment events and 70 baseline events.
To simplify the provision and processing of data, all iviaction logs are grouped into one iviaction.csv file, all ivievent logs into one ivievent.csv file and all CAM logs into one CAM.csv file. Individual events can be identified through unique combinations of the (log_stationid, eventid) fields. As defined in the log format specification, each event should begin with eventmodelid=5 and eventactionid=1 and end with eventmodelid=5 and eventactionid=3. In case there are multiple instances of these combination for one event, the first (5,1) and (5,3) are used to define the start and end of the event.
You can download the log data here.
FI in Bordeaux
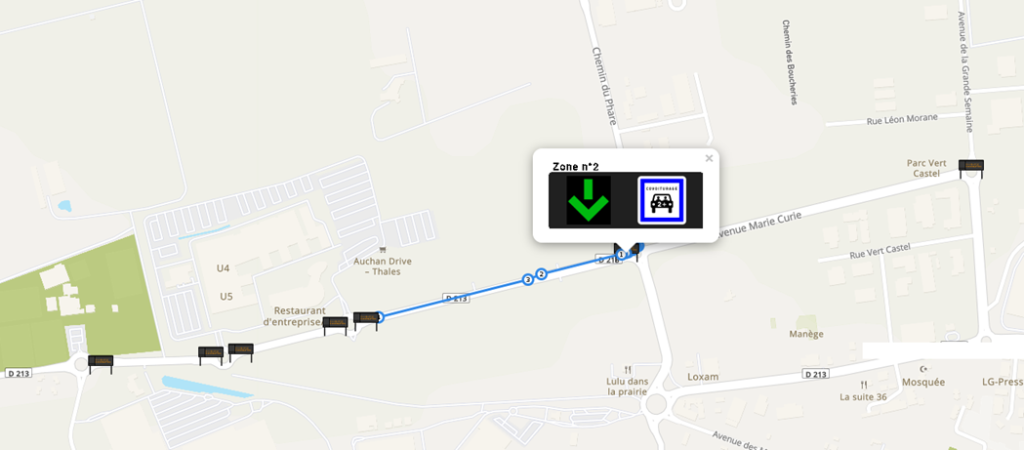
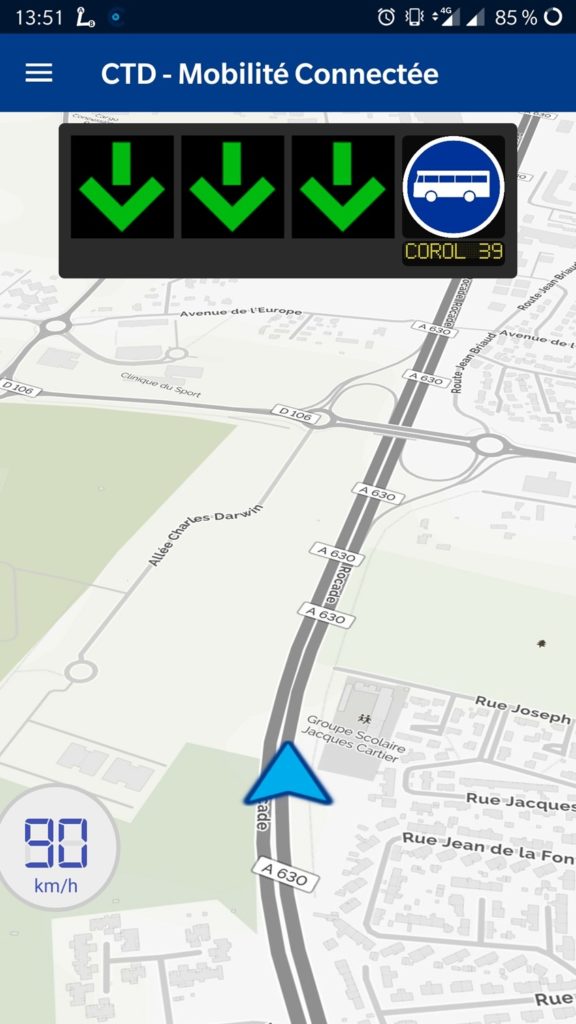
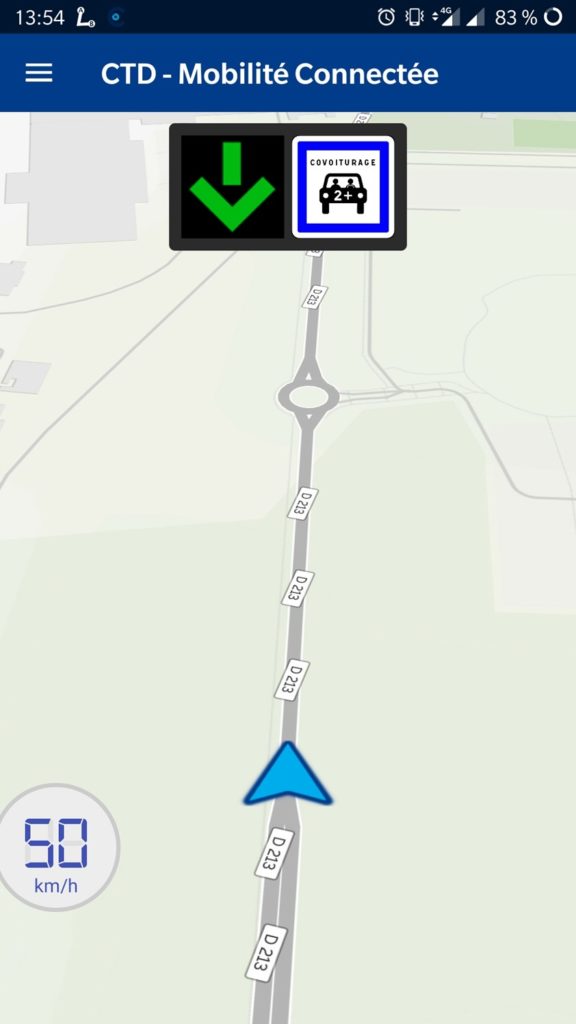
The motivation to deploy Flexible Infrastructure in Bordeaux is to inform the user about the road configuration in two specific areas : the ring road, where buses are authorized to drive on the hardshoulder, and a corridor where the bus lane can be used for carpooling.
Sample Data Description (BOR)
For the evaluation of the Flexible Infrastructure service deployment in Bordeaux, the relevant log items are the iviaction, ivievent and CAM log files. All of these log files are automatically recorded by the PID of the user. The ivievent logs contain the basic information for each event (e.g. timestamp, log_stationid, iviidentificationnumber etc.). The iviaction logs contain the status of the HMI and thus record the information that was presented to the driver at each moment in time with a frequency of approximately 1Hz. The following fields are particularly relevant for the Flexible Infrastructure data:
- servicecategorycode (=12),
- pictogramcategorycode (=134, ‘car pooling’ or 129, ‘bus allowed on hard sholder’) to filter the relevant FI events
- Warningdistance: indicating the distance to the event location
The CAM logging is mainly used to derive the vehicle position, speed and acceleration for the entire duration of the event, also at a frequency of approximately 1Hz. For a more in-depth description of the logging format and the data fields in each log type please visit Open Common Log Data Format.
The example data set provided here consists of all Flexible Infrastructure events logged in Bordeaux between 01/10/2020 and 01/04/2021. The data set includes both baseline and treatment events. ‘Baseline’ indicates that the service was not active (no information was presented to the driver) and is used as a point of reference, whereas ‘treatment’ events are logged when the service is fully functional. Separating events by baseline/treatment is possible by analyzing the content of the tlmaction log files and, more specifically, by checking for the existence of rows where eventmodelid==6 (indicating that certain information was displayed on the screen). The NeoGLS app deployed in Bordeaux randomly switches between baseline/treatment with pre-defined probabilities (percentage of baseline events is 25%). Therefore, the example data set provided here consists of roughly 280 treatment events and 70 baseline events.
To simplify the provision and processing of data, all iviaction logs are grouped into one iviaction.csv file, all ivievent logs into one ivievent.csv file and all CAM logs into one CAM.csv file. Individual events can be identified through unique combinations of the (log_stationid, eventid) fields. As defined in the log format specification, each event should begin with eventmodelid=5 and eventactionid=1 and end with eventmodelid=5 and eventactionid=3. In case there are multiple instances of these combination for one event, the first (5,1) and (5,3) are used to define the start and end of the event.
Since the main aim of the service is simply to inform users about the current road configuration and no major impacts on the traffic flow are expected, evaluation data and results are not presented for the FI service.
You can download the log data here.
GLOSA in Bordeaux
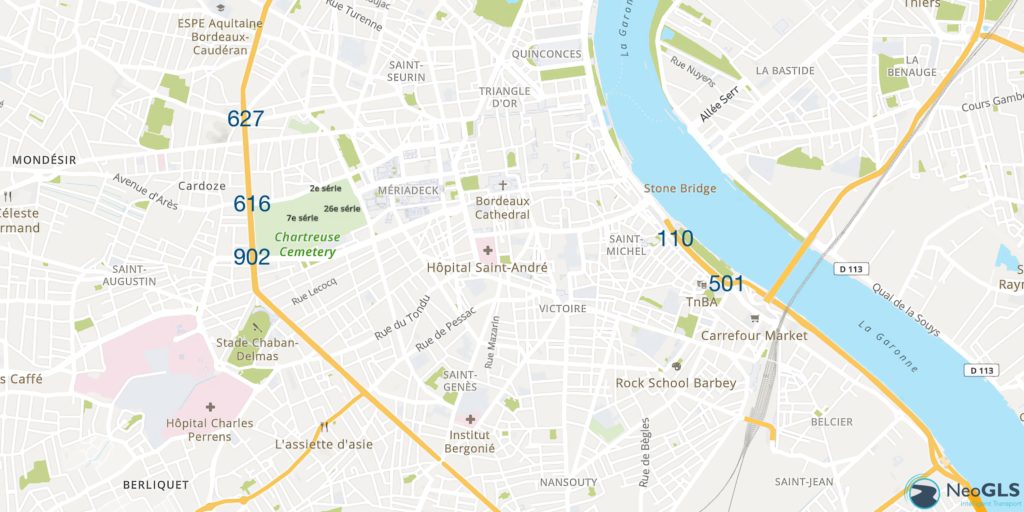
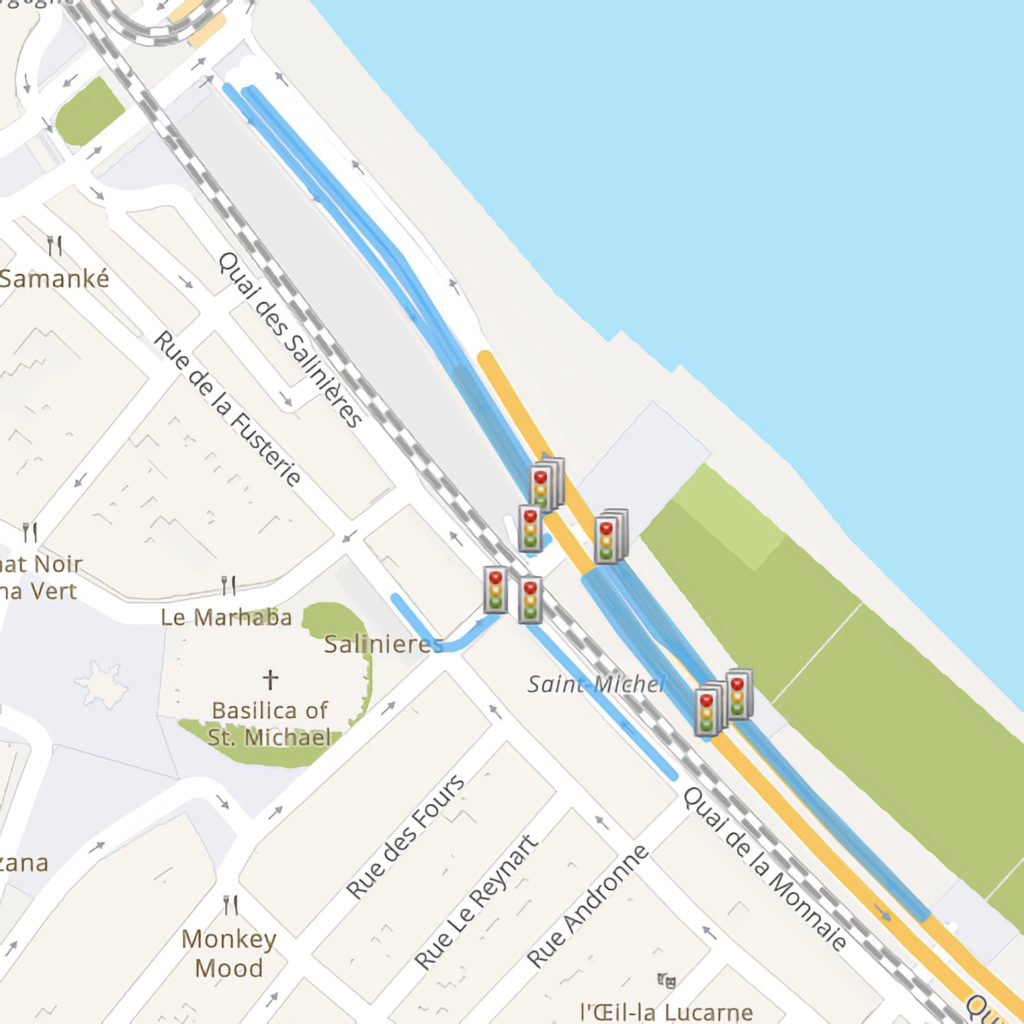
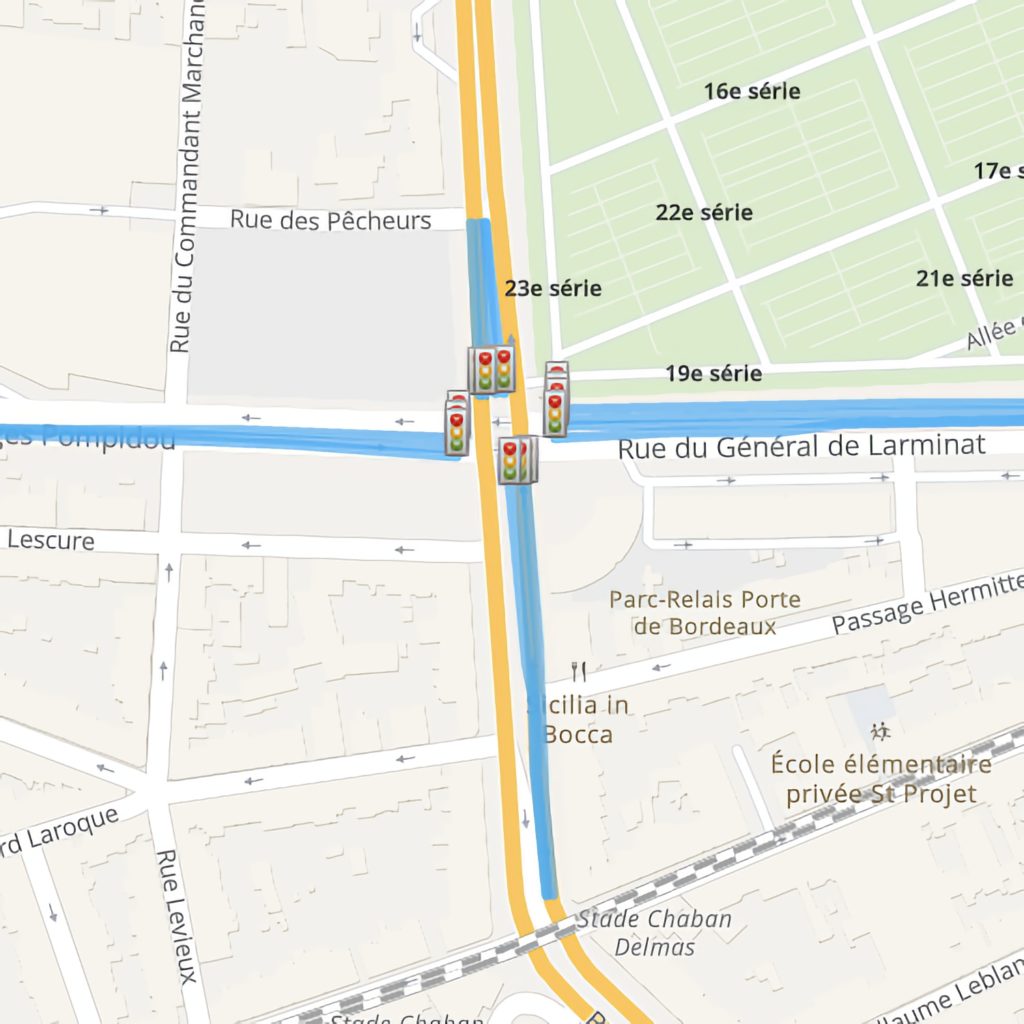
Bordeaux has a lot of traffic light intersections which are used daily by a high number of drivers, causing congestion and pollution. GLOSA was deployed on around 600 intersection in order to have the best possible impact. The following results describe the GLOSA analysis on the 5 most used intersections in Bordeaux.
Sample Data Description
For the evaluation of the GLOSA deployment in Bordeaux, the relevant log items are the tlmaction, tlmevent and CAM log files. All of these log files are automatically recorded by the PID of the user. The tlmevent logs contain the basic information for each event (e.g. timestamp, log_stationid, intersectionid etc.). The tlmaction logs contain the status of the HMI and thus record the information that was presented to the driver at each moment in time with a frequency of approximately 1Hz. Relevant fields include the speed advice (if shown), the current and next signal phase and the distance to the stop line. The CAM logging is mainly used to derive the vehicle position, speed and acceleration for the entire duration of the event, also at a frequency of approximately 1Hz. For a more in-depth description of the logging format and the data fields in each log type please visit Open Common Log Data Format.
The example data set provided here consists of all GLOSA events logged in the intersections listed above. The data set includes both baseline and treatment events. ‘Baseline’ indicates that the service was not active (no information was presented to the driver) and is used as a point of reference, whereas ‘treatment’ events are logged when the service is fully functional. Separating events by baseline/treatment is possible by analyzing the content of the tlmaction log files and, more specifically, by checking for the existence of rows where eventmodelid==6 (indicating that certain information was displayed on the screen). The NeoGLS app deployed in Bordeaux randomly switches between baseline/treatment with pre-defined probabilities (percentage of baseline events was 25% at the start of the deployment and 15% later on). Therefore, the example data set consists of roughly 80% treatment events and 20% baseline events.
To simplify the provision and processing of data, all tlmaction logs are grouped into one tlmaction.csv file, all tlmevent logs into one tlmevent.csv file and all CAM logs into one CAM.csv file.
You can download the log data here.


Evaluation Results
Several indicators can be used to evaluate the impact of GLOSA on the traffic flow in terms of safety and efficiency. The following table briefly describes some of the main indicators. GLOSA is expected to have an impact on both the efficiency and the safety of traffic. It is expected to decrease the number of stops while approaching the intersections, since drivers should gradually slow down well before a red light. This will also increase the maximum deceleration (less hard braking expected) and decrease the maximum acceleration (which mostly occurs from standstill after a stop).
| Short name | Long name | Description | Expected effect |
| numberofstops | Number of stops | How many times does the vehicle stop during the event (intersection approach and passage) | decrease |
| meanspeed | Mean speed | The mean speed of the vehicle during the event | decrease |
| speedvariance | Speed variance | Standard deviation of the speed of one vehicle during the event | decrease |
| maxdeceleration | Maximum deceleration | The maximum deceleration (braking intensity) of the vehicle during the event | increase |
| maxacceleration | Maximum acceleration | The maximum acceleration of the vehicle during the event | decrease |
| … | … | … |
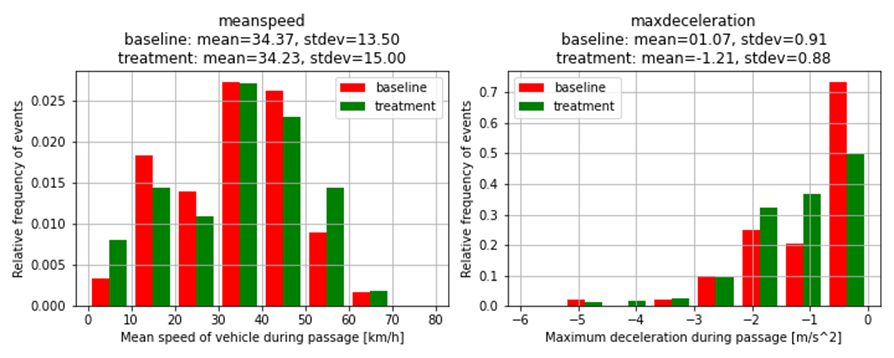
The evaluation results data set provided here also contains a table with the above-mentioned indicators calculated for each event. The overall impact of GLOSA can then be calculated by grouping events by baseline/treatment and comparing the indicator averages over both groups. The following table gives an overview of the main indicators as extracted from the sample data for one intersection (intersectionid = 110). The results based on the sample data indicate that, when using the service, the average number of stops decreases by 14%, which is positive in terms of the efficiency. The speed variance within events also decreases by almost 20%. However, in this example the maximum deceleration also increases by 13%, indicating that in this intersection the service does not have a significant impact on traffic safety.
| Indicator | Baseline mean (n=179) |
Treatment mean (n=711) |
Percentage difference |
| maxdeceleration | -1.07 | -1.21 | -13 % |
| maxacceleration | 1.63 | 1.39 | -15% |
| numberofstops | 0.36 | 0.31 | -14% |
| speedvariance | 124.44 | 100.5 | -19% |
| meanspeed | 34.37 | 34.23 | -0% |
| … | … | … |
To better understand and evaluate these indicators, the mean values are not enough. The probability density functions (PDF) of the indicators for baseline and treatment should also be considered. The following figure illustrates this concept for two of the indicators. Although there is a clear difference in the mean values between baseline and treatment, the relatively widely dispersed distributions and high standard deviation values suggest that the impact of the service is still uncertain.
In order to have more robust and meaningful evaluation results, a larger data sample and a more in-depth analysis of the data (e.g. filtering events by certain criteria, taking into consideration peak/off-peak traffic conditions, checking for incomplete events or errors in the log data etc.) is required. For further details on this please consult <add link to D6.4 (when it will be published)>.
You can download the evaluation data here.
GP in Helmond
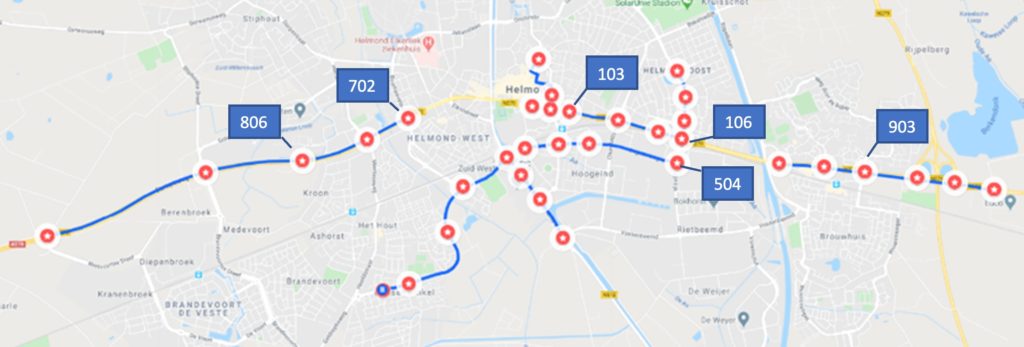
Helmond is one of the cities in the North Brabant Deployment Site. The intersection controllers in the city of Helmond are equipped with road side units for ITS-G5 communication to provide cooperative services such as Emergency Vehicle Priority and Green Priority services.
Emergency vehicles of the city of Helmond are authorized to request the highest level of priority in emergency situations when sirens and blue lightbars are used. Priority is granted for all signal groups on the approach of the emergency vehicle to clear the approach and conflict area ahead. This increases both the safety of the emergency vehicle and other road users, and reduces the emergency response time.
Green Priority is provided to selected logistic companies on selected routes through the city to help their heavy goods vehicles with speed advice to pass with green light more smoothly. The intersection controllers provide both the speed advice and priority to the logistic vehicles.
The on board units (OBU) send CAM and SRM (Service Request Message) to request priority at the intersection controllers. The road side units of the intersection controllers send MAPEM, SPATEM and respond to SRM with SSM (Signal Status Message).
Sample Data Description
For the Emergency Vehicle Priority and Green Priority services all messages (CAM, MAPEM, SPATEM, SRM and SSM) are logged on the OBU and RSU during intersection pass events. The emergency vehicles do not have an HMI, hence the HMI logging is not available, and all intersection pass events are analysed from the messages. Logistic vehicles log all intersection pass events from their HMI in tlmevent and tlmaction file format. The speed advices for the logistic vehicles are also available from the speed profiles in the SPATEM. MAPEM messages are included only once for the intersections indicated on the map above. For a more in-depth description of the logging format and the data fields in each log type please visit Open Common Log Data Format.
Example data sets are provided over the period of November 2020 to April 2021 for both baseline and treatment events. In baseline events, an OBU does not request priority. In treatment events the OBU does request priority, but priority cannot be granted in every situation. For emergency vehicles all events are emergency situations. Emergency vehicle events are provided on intersections 106, 504, 702, 903. For green priority for logistic vehicles events are included on intersections 103 and 806.
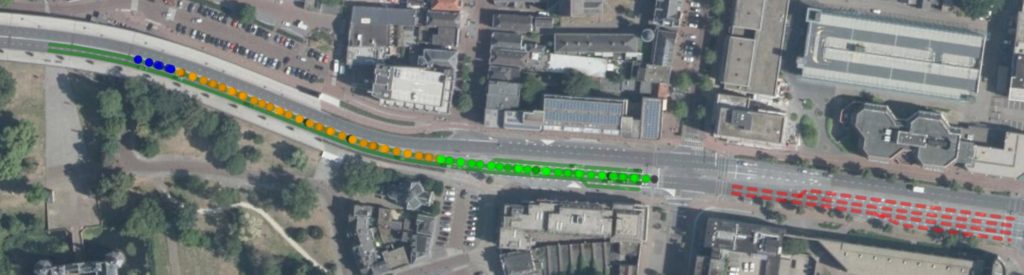
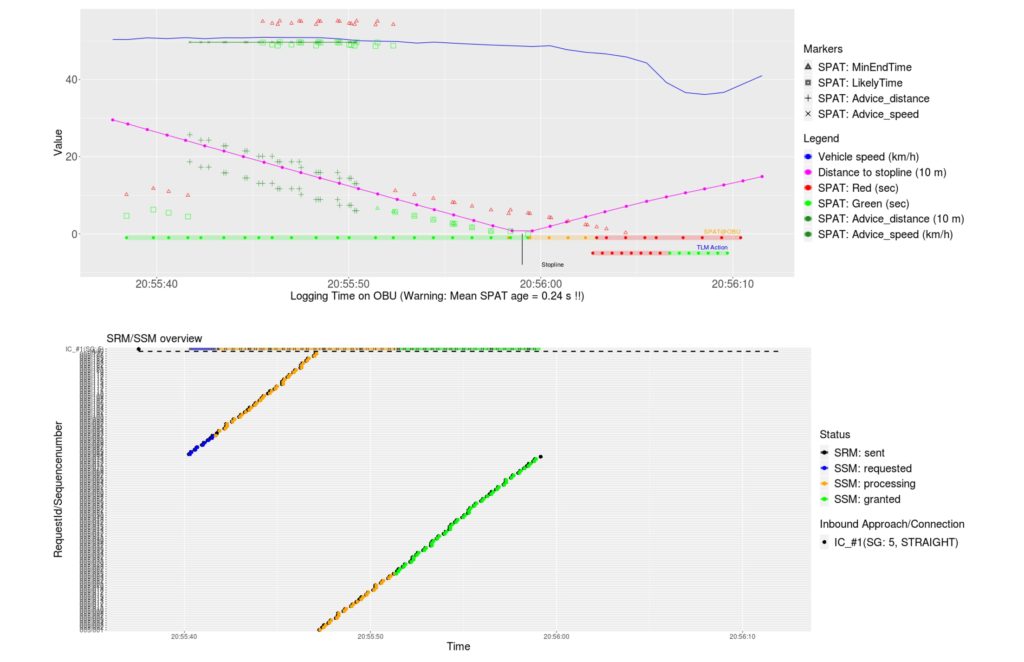
The following plots show an example of the logging in a Green Priority pass event. The vehicle approaches the intersection from the West. The ingress and egress approaches from the MAPEM are shown as dark green and red dashed lines on the map. The dots on the map show the vehicle trajectory from the CAM, where the colour represents the status of priority processing from the SSM. The data plot in the middle shows the time line of the event with the traffic light status (green, amber, red) from the SPATEM on the x-axis, vehicle speed from the CAM (blue line), distance to the stop line (purple line), and the remaining phase time from the SPATEM as red and green markers. The dark green line is the speed advice derived from the SPAT speed profile. The last plot shows the sequence of SRM messages (black dots) and SSM responses on the time line. The vertical axis indicate the SRM message id. As soon as priority is granted (green SSM dots), the SPAT speed advice ends and the green phase is extended till the vehicle has passed the stop line.
You can download the log data here.
Evaluation Results
Priority services are evaluated on three criteria: success rate of priority granting, safety and travel time gain.
Intersection controllers cannot provide priority in all situations. The ratio of granted versus denied priority requests is evaluated for both services. As can be expected, the ratio of granted priorities for emergency vehicles is very high (but not 100%) and much higher than for logistic vehicles.
The safety for emergency vehicles can be increased with the priority service. Approaches and conflict areas can be cleared more often than in baseline situations. Emergency vehicles are slowed down less often by other traffic, and fewer red-light crossings are observed in emergency situations. Also the average time to cross an intersection is reduced.
Green priority services to logistic vehicles is a different service and aims to help drivers to decide to pass or stop from the beginning of the approach to the intersection rather than the very last moment. The intersection controller can only help in favourable situations and does not try to give logistic vehicles a significant advantage with more frequent passes (less stops) or an overall travel time advantage compared to the baseline situation.
Following parameters are provided to relate events in the evaluation data to the log data:
| Short name | Link to Log data |
| vehiclerole | CAM vehicle role indicating whether the vehicle is in an ‘emergency’ situation or not |
| lightbarsiren | CAM light bar and siren flag as On or Off |
| priorityrequest
|
Flag indicating whether the OBU sent a request or not to the intersection controller |
| prioritydecision | Final decision by the intersection controller to grant or reject a priorityrequest, or no response is returned (absent) |
| starttimestamp,
stoptimestamp |
Epoch UTC timestamps (milliseconds) in the log data where the OBU enters the ingress and exits the egress of an intersection pass. |
| intersection
|
Name, identifier, region code, and revision number of the intersection in the MAPEM, SPATEM, SRM and SSM |
| signalgroup,
turn direction |
Interpretation of the intersection turn manoeuvre made by the OBU |
| speedlimitingress,
speedlimitegress |
Speed limit in km/h from the MAP on the ingress or egress approach |
| stoplinespeed | Vehicle speed when passing the stop line in km/h |
Relevant indicators in the evaluation data set. The event includes the period on the ingress and egress approaches and on the conflict area:
| Short name | Long name | Description | Expected effect with priority | |
| Emergency vehicle | Logistic vehicle | |||
| passclassification | Classification of vehicle speed | Classification of speed profile of the OBU on the ingress approach (Free pass, varying speed, almost stopped, stopped, multiple stops), see D6.4 for definitions. | Increase in number of passes (decrease stops) | Increase in number of passes (decrease stops) |
| prioritydecision | Priority decision | Final decision by the intersection controller to grant or deny priority, or whether no response is returned (absent). | Most granted / few rejected | No overall effect |
| averagespeedingress averagespeedevent | Average speed in km/h | Average speed on the ingress, or complete event (ingress, conflict area, egress) | Increase | Increase |
| speedlimitlosstime | Time loss | Time loss over the complete event ((ingress, conflict area, egress) relative to a pass at the speed limits on the ingress and egress | Decrease | No overall effect |
| numberofstops | Number of stops | Number of stops in an event before the stop line is passed (0 = pass without a stop) | Decrease | No effect |
| stoplinephase | Signal phase at stop line | Signal phase (red, green, amber) when passing the stop line | Decrease in red-light crossings | No effect |
You can download the evaluation data here.
IVS (speed limit) in Barcelona
Regular speed limit in Barcelona city is 50km/h. However, there are streets and special areas in which that limit is lower, i.e. 20km/h and 30km/h. The In-Vehicle Signage service informs the user of such cases.

Sample Data Description
For the evaluation of the IVS (speed limit) service deployment in Barcelona, the relevant log items are the iviaction, ivievent and CAM log files. All of these log files are automatically recorded by the PID of the user. The ivievent logs contain the basic information for each event (e.g. timestamp, log_stationid, iviidentificationnumber etc.). The iviaction logs contain the status of the HMI and thus record the information that was presented to the driver at each moment in time with a frequency of approximately 1Hz. The following fields are particularly relevant for the IVS (speed limit) data:
- Speedlimit (between 10 km/h and 130 km/h with the majority of events occurring in 50 km/h and 80 km/h zones)
- servicecategorycode (=12), pictogramcategorycode (=557) and text (hex-encoded, = ‘56656c6f6369646164206dc3a178696d61’) to filter IVS (speed limit) events from other events using IVI messages
- Warningdistance: indicating the distance to the event location
The CAM logging is mainly used to derive the vehicle position, speed and acceleration for the entire duration of the event, also at a frequency of approximately 1Hz. For a more in-depth description of the logging format and the data fields in each log type please visit Open Common Log Data Format.
The example data set provided here consists of all IVS (speed limit) events logged in Barcelona between 01/02/2021 and 01/04/2021. The data set includes both baseline and treatment events. ‘Baseline’ indicates that the service was not active (no information was presented to the driver) and is used as a point of reference, whereas ‘treatment’ events are logged when the service is fully functional. Separating events by baseline/treatment is possible by analyzing the content of the tlmaction log files and, more specifically, by checking for the existence of rows where eventmodelid==6 (indicating that certain information was displayed on the screen). The Idiada app deployed in Barcelona randomly switches between baseline/treatment with pre-defined probabilities (percentage of baseline events is 25%). Therefore, the example data set provided here consists of roughly 2,200 treatment events and 1,800 baseline events.
To simplify the provision and processing of data, all iviaction logs are grouped into one iviaction.csv file, all ivievent logs into one ivievent.csv file and all CAM logs into one CAM.csv file. Individual events can be identified through unique combinations of the (log_stationid, eventid) fields. As defined in the log format specification, each event should begin with eventmodelid=5 and eventactionid=1 and end with eventmodelid=5 and eventactionid=3. In case there are multiple instances of these combination for one event, the first (5,1) and (5,3) are used to define the start and end of the event.
You can download the log data here.
Evaluation Results
Several indicators can be used to evaluate the impact of IVS (speed limit) on the traffic flow, mainly in terms of safety. The following table briefly describes some of the main indicators. IVS (speed limit) is expected to decrease the mean speed and the frequency of speed violations, since drivers should be more aware of the speed limit. Furthermore, the speed variance should also decrease, both within each event and between all vehicle passages.
| Short name | Long name | Unit | Description | Expected effect |
| meanspeed | Mean speed | km/h | The mean speed of the vehicle during the event | decrease |
| speedstdev | Speed standard deviation | km/h | Standard deviation of the speed of one vehicle during the event | decrease |
| isspeedviolation | Is speed violation | Bool | Indicates whether a speed violation occurs or not during event (bool) | decrease |
| Speedviolation_percentage | Speed violation percentage | % | The percentage of time in which there was a speed limit violation during the event | decrease |
| initialspeed | Initial speed | km/h | The speed of the vehicle at the moment of the first warning | none |
| … | … | … |
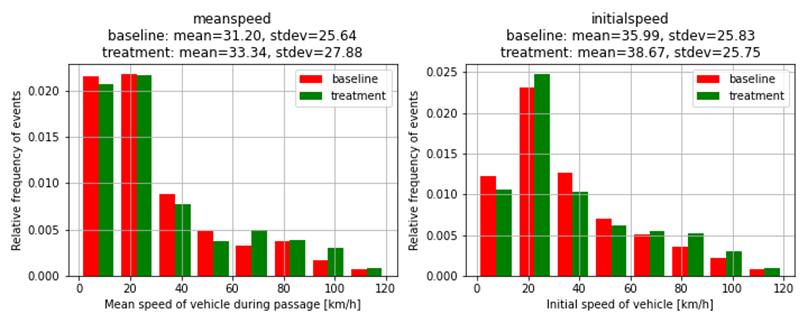
The evaluation results data set provided here also contains a table with the above-mentioned indicators calculated for each event. The overall impact of IVS (speed limit) can then be calculated by grouping events by baseline/treatment and comparing the indicator averages over both groups. The following table gives an overview of the main indicators as extracted from the sample data. The results based on the sample data indicate that, when using the service, the mean speed and the speed variance (standard deviation of speed during the event) increase. At the same time, the frequency and duration of speed violation decreases, which has positive implications on the traffic safety.
| Indicator | Baseline mean (n=1110) |
Treatment mean (n=1095) |
Percentage difference |
| meanspeed | 31.20 | 33.34 | +7 % |
| speedstd | 9.33 | 9.53 | +2% |
| isspeedviolation | 0.63 | 0.59 | -6% |
| Speedviolation_percentage | 0.28 | 0.24 | -14% |
| initialspeed | 35.99 | 38.67 | +7% |
| … | … | … |
To better understand and evaluate these indicators, the mean values are not enough. The probability density functions (PDF) of the indicators for baseline and treatment should also be considered. The following figure illustrates this concept for two of the indicators. Although there is a clear difference in the mean values between baseline and treatment, the relatively widely dispersed distributions and high standard deviation values suggest that the impact of the service is still uncertain.
In order to have more robust and meaningful evaluation results, a larger data sample and a more in-depth analysis of the data (e.g. filtering events by certain criteria, taking into consideration peak/off-peak traffic conditions, checking for incomplete events or errors in the log data etc.) is required. For further details on this please consult <add link to D6.4 (when it will be published)>.
You can download the evaluation data here.
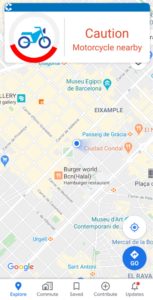
MAI in Barcelona
Barcelona is one of the European cities with most motorcycles on its streets. These vehicles are usually involved in accidents. Many of those happen in intersections with low visibility. The Motorcycle Approaching Indication service alerts car (or larger vehicle) users to the presence of motorcycles in such dangerous scenarios.
Sample Data Description
For the evaluation of the MAI service deployment in Barcelona, the relevant log items are the denmaction, denmevent and CAM log files. All of these log files are automatically recorded by the PID of the user. The denmevent logs contain the basic information for each event (e.g. timestamp, log_stationid, eventcausecode etc.). The denmaction logs contain the status of the HMI and thus record the information that was presented to the driver at each moment in time with a frequency of approximately 1Hz. The following fields are particularly relevant for the RWW service:
- Warningdistance: indicating the distance to the event location
- Servicecategorycode: indicating the message displayed on the HMI
- Pictogramcategorycode: indicating the pictogram displayed on the HMI
The eventcausecode field from the denmevent tables, in combination with the servicecategorycode and pictogramcategorycode fields from the denmaction tables, enables the evaluator to differentiate between the different services using the same message types (DENM). The following combinations of values defines the MAI service deployed in Barcelona:
| Service | DENMevent causecode | DENMaction servicecategorycode | DENMaction pictogramcategorycode |
| MAI | == 97 | == 11 | == 999 |
The CAM logging is mainly used to derive the vehicle position, speed and acceleration for the entire duration of the event, also at a frequency of approximately 1Hz. For a more in-depth description of the logging format and the data fields in each log type please visit Open Common Log Data Format.
The example data set provided here consists of all MAI events logged in Barcelona. The data set includes both baseline and treatment events. ‘Baseline’ indicates that the service was not active (no information was presented to the driver) and is used as a point of reference, whereas ‘treatment’ events are logged when the service is fully functional. Separating events by baseline/treatment is possible by analyzing the content of the denmaction log files and, more specifically, by checking for the existence of rows where eventmodelid==6 (indicating that certain information was displayed on the screen). The Idiada app deployed in Barcelona randomly switches between baseline/treatment with pre-defined probabilities (percentage of baseline events is 25%). The example data set provided here consists of roughly 20 valid treatment events and 40 baseline events.
To simplify the provision and processing of data, all denmaction logs are grouped into one iviaction.csv file, all denmevent logs into one ivievent.csv file and all CAM logs into one CAM.csv file. Individual events can be identified through unique combinations of the (log_stationid, eventid) fields. As defined in the log format specification, each event should begin with eventmodelid=5 and eventactionid=1 and end with eventmodelid=5 and eventactionid=3. In case there are multiple instances of these combination for one event, the first (5,1) and (5,3) are used to define the start and end of the event.
You can download the log data here.
Evaluation Results
Several indicators can be used to evaluate the impact of MAI on the traffic flow, mainly in terms of safety. The following table briefly describes some of the main indicators. MAI is expected to decrease the mean speed of the vehicles. Furthermore, it should increase the maximum deceleration (since these are negative values it is a decrease in absolute terms) and decrease the frequency of hard braking, since drivers should be more aware of the vulnerable road users they might encounter.
| Short name | Long name | Unit | Description | Expected effect |
| maxdeceleration | Maximum deceleration | m/s2 | The maximum deceleration (in m/s2) with which the vehicle is breaking during the event. | increase |
| ishardbraking | Hard braking | bool | Bool variable indicating whether there is any deceleration greater than 3 m/s2 | decrease |
| meanspeed | Mean speed | km/h | Mean speed of the vehicle during the event | decrease |
| maxspeed | Maximum speed | km/h | Maximum speed of the vehicle during the event | decrease |
| initialspeed | Initial speed | km/h | Spot speed of the vehicle at the point in time where the event / logging starts | n.a. |
| percspeed_5 | Percentage speed 5s | % | Percentage of the vehicle spot speed at 5s after the first HMI notification compared to initial speed | decrease |
| … | … | … | … |
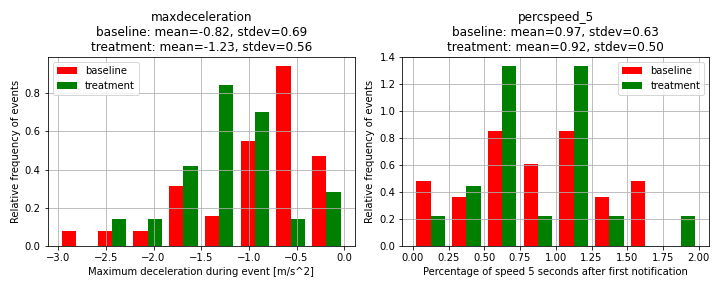
The evaluation results data set provided here also contains a table with the above-mentioned indicators calculated for each event. The overall impact of MAI can then be calculated by grouping events by baseline/treatment and comparing the indicator averages over both groups. The following table gives an overview of the main indicators as extracted from the sample data. Since the overall number of events considered is low, the results are not statistically significant. Maximum deceleration values seem to decrease slightly when using the service. The mean speed decreases, but this might be a direct consequence of the initial speed also being lower in treatment. The percentage speed 5 seconds after the first HMI notification is lower in treatment (and also lower than 1, hinting to a slight braking), showing that drivers react positively to the message being shown.
| Indicator | Baseline mean (n=37) | Treatment mean (n=19) | Percentage difference |
| maxdeceleration | -0.82 | –1.23 | -50% |
| ishardbraking | 0 | 0 | na |
| meanspeed | 25.43 | 12.12 | -52% |
| maxspeed | 36.33 | 24.04 | -35% |
| initialspeed | 25.45 | 14.12 | -45% |
| Percspeed_5 | 0.97 | 0.92 | -6% |
| … | … | … |
To better understand and evaluate these indicators, the mean values are not enough. The probability density functions (PDF) of the indicators for baseline and treatment should also be considered. The following figure illustrates this concept for two of the indicators. Although there is a clear difference in the mean values between baseline and treatment, the relatively widely dispersed distributions and high standard deviation values suggest that the impact of the service is still uncertain.
In order to have more robust and meaningful evaluation results, a larger data sample and a more in-depth analysis of the data (e.g. filtering events by certain criteria, taking into consideration peak/off-peak traffic conditions, checking for incomplete events or errors in the log data etc.) is required. For further details on this please consult <add link to D6.4 (when it will be published)>.
You can download the evaluation data here.
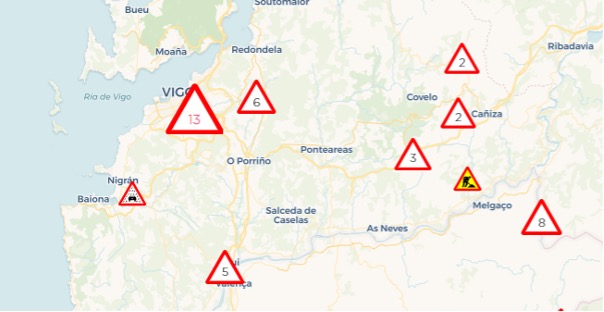
RHW in Vigo
The city of Vigo has been gradually increasing and developing strategies for the improvement and optimization of urban mobility. Due to improvements in infrastructures, road and roadway, several works are being carried out in strategic points of the city.
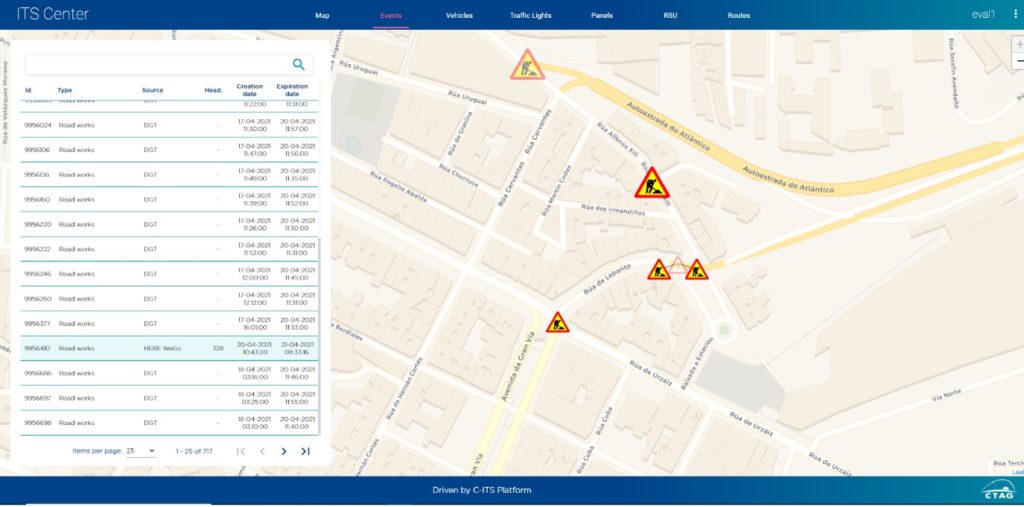
The RHW service makes it possible to identify the points where different dangers are taking place. These warning allow the user to avoid dangerous situations or to be warned about them.
Sample Data Description
For RHW service, the necessary data is allocated in the denmevent, denmaction and CAM logging (as it’s a service based in DENM and CAM contain all the information about the vehicle). This logging is carried out by the user’s PID.
For the sake of simplicity, all the events are grouped in three files, the denmevent, demaction and CAM files, which contain the denmevent, denmaction and CAM data, respectively. All the data has been recorded at 1 Hz frequency, excepting a period in which the CAM data was being recorded at 0.5 Hz.
Each singular event can be discerned selecting different (log_stationid, eventid) combinations. Each of them should begin with the (eventmodelid, eventactionid) pair being (5, 1) and sould end with a (eventmodelid, eventactionid) pair being (5, 3). If there are entries with eventmodelid=6 in the event, it means that the event was in treatment mode (i.e: the information was presented to the user), if that is not the case, the event was in baseline and the information was not presented.
The most important fields are on the denmevent file, they can be observed in the following table.
Example of table/list with relevant indicators:
| Short name | Long name | Description |
| originatingstationid | Stationid of the event’s creator | This is the stationid of the unit that created the event, it’s extracted from the DENM. |
| sequencenumber | Sequence number of the message | The sequence number of the DENM, used to link the event to the message. |
| eventcausecode | Cause code of the event | The cause code is used to know which kind of event it is. These eventcausecodes can be consulted in [1]. |
| eventsubcausecode | Sub-cause code of the event | The sub-type of the event. These eventsubcausecodes can be consulted in [1]. |
You can download the log data here.
Evaluation Results
There are several indicators to evaluate the performance of RHW service. The most important ones are related to the speed and acceleration profiles of the user. In the evaluation file a table can be observed with the results for each event. In the following table some of these indicators are explained.
Example of table/list with relevant indicators:
| Short name | Long name | Description | Expected effect |
| numberofstops | Number of stops | How many times does the vehicle stop during the event (intersection approach and passage) | decrease |
| meanspeed | Mean speed | The mean speed of the vehicle during the event | decrease |
| speedvariance | Speed variance | Standard deviation of the speed of one vehicle during the event | decrease |
| maxdeceleration | Maximum deceleration | The maximum deceleration (braking intensity) of the vehicle during the event | increase |
| maxacceleration | Maximum acceleration | The maximum acceleration of the vehicle during the event | decrease |
| … | … | … |
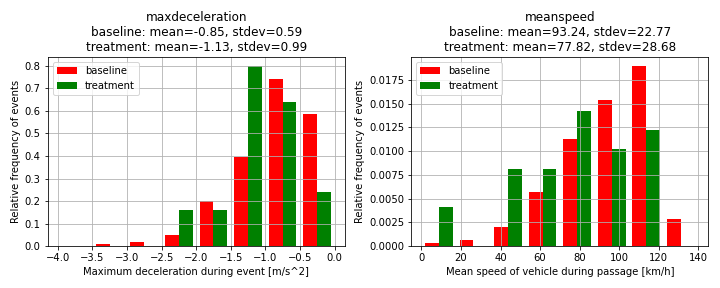
The overall impact of RHW can then be calculated by grouping events by baseline/treatment and comparing the indicator averages over both groups. The following table gives an overview of the main indicators as extracted from the sample data. Maximum deceleration values and the frequency of hard braking seem to increase when using the service. The mean speed also decreases, but this might be a direct consequence of the initial speed also being lower in treatment events. The percentage speed 5 seconds after the first HMI notification does not differ significantly from 1 in either baseline or treatment, showing that drivers’ behavior is not affected very much by the road hazard situations.
| Indicator | Baseline mean (n=363) | Treatment mean (n=28) |
Percentage difference |
| maxdeceleration | -0.85 | -1.13 | -33% |
| ishardbraking | 0.6% | 3.6% | +550% |
| meanspeed | 93.24 | 77.82 | -16% |
| maxspeed | 105.86 | 92.14 | -13% |
| initialspeed | 89.52 | 77.1 | -14% |
| Percspeed_5 | 1.02 | 1.05 | +2% |
| … | … | … |
To better understand and evaluate these indicators, the mean values are not enough. The probability density functions (PDF) of the indicators for baseline and treatment should also be considered. The following figure illustrates this concept for two of the indicators. Although there is a clear difference in the mean values between baseline and treatment, the relatively widely dispersed distributions and high standard deviation values suggest that the impact of the service is still uncertain.
In order to have more robust and meaningful evaluation results, a larger data sample and a more in-depth analysis of the data (e.g. filtering events by certain criteria, taking into consideration peak/off-peak traffic conditions, different user groups, checking for incomplete events or errors in the log data etc.) is required. For further details on this please consult <add link to D6.4 (when it will be published)>.
You can download the evaluation data here.
RWW in Vigo
The city of Vigo has been gradually increasing and developing strategies for the improvement and optimization of urban mobility. Due to improvements in infrastructures, road and roadway, several works are being carried out in strategic points of the city.
The RWW service makes it possible to identify the points where road works are being carried out and allows users to optimize their routes and move around more safely.
Sample Data Description
For RWW service, the necessary data is allocated in the denmevent, denmaction and CAM logging (as it’s a service based in DENM and CAM contain all the information about the vehicle). This logging is carried out by the user’s PID.
For the sake of simplicity, all the events are grouped in three files, the denmevent, demaction and CAM files, which contain the denmevent, denmaction and CAM data, respectively. All the data has been recorded at 1 Hz frequency, excepting a period in which the CAM data was being recorded at 0.5 Hz.
Each singular event can be discerned selecting different (log_stationid, eventid) combinations. Each of them should begin with the (eventmodelid, eventactionid) pair being (5, 1) and sould end with a (eventmodelid, eventactionid) pair being (5, 3). If there are entries with eventmodelid=6 in the event, it means that the event was in treatment mode (i.e: the information was presented to the user), if that is not the case, the event was in baseline and the information was not presented.
The most important fields are on the denmevent file, they can be observed in the following table.
Example of table/list with relevant indicators:
| Short name | Long name | Description |
| originatingstationid | Stationid of the event’s creator | This is the stationid of the unit that created the event, it’s extracted from the DENM. |
| sequencenumber | Sequence number of the message | The sequence number of the DENM, used to link the event to the message. |
| eventcausecode | Cause code of the event | The cause code is used to know which kind of event it is. For RWW, eventcausecode = 3. |
| eventsubcausecode | Sub-cause code of the event | The sub-type of the event. As there are no sub-types for RWW in Vigo, eventsubcausecode = 0. |
You can download the log data here.
Evaluation Results
There are several indicators to evaluate the performance of RHW service. The most important ones are related to the speed and acceleration profiles of the user. In the evaluation file a table can be observed with the results for each event. In the following table some of these indicators are explained.
Example of table/list with relevant indicators:
| Short name | Long name | Unit | Description | Expected effect |
| meanspeed | Mean speed | km/h | The mean speed of the vehicle during the event | decrease |
| speedstdev | Speed variance | km/h | Standard deviation of the speed of one vehicle during the event | decrease |
| maxdeceleration | Maximum deceleration | m/s^2 | The maximum deceleration (braking intensity) of the vehicle during the event | increase |
| maxacceleration | Maximum acceleration | m/s^2 | The maximum acceleration of the vehicle during the event | decrease |
| … | … | … |
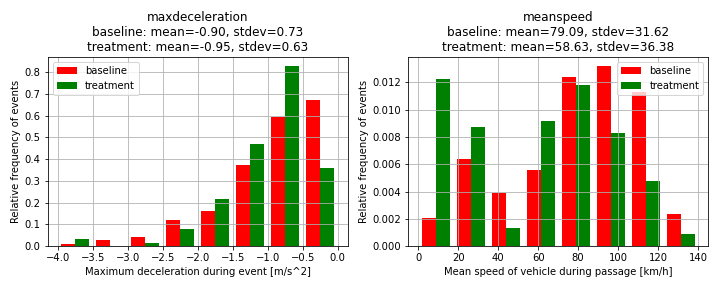
The overall impact of RWW can then be calculated by grouping events by baseline/treatment and comparing the indicator averages over both groups. The following table gives an overview of the main indicators as extracted from the sample data. Maximum deceleration values and the frequency of hard braking seem to increase when using the service. The mean speed also decreases, but this might be a direct consequence of the initial speed also being lower in treatment events. The percentage speed 5 seconds after the first HMI notification is slightly lower than 1 in treatment, showing that drivers slightly reduce their speed in response to the information about the road works situation.
| Indicator | Baseline mean (n=411) |
Treatment mean (n=131) |
Percentage difference |
| maxdeceleration | -0.90 | -0.95 | -6% |
| ishardbraking | 1.0% | 1.5% | +57% |
| meanspeed | 79.09 | 58.93 | -26% |
| maxspeed | 91.95 | 71.68 | -22% |
| initialspeed | 77.33 | 58.03 | -25% |
| Percspeed_5 | 1.05 | 0.97 | -8% |
| … | … | … |
To better understand and evaluate these indicators, the mean values are not enough. The probability density functions (PDF) of the indicators for baseline and treatment should also be considered. The following figure illustrates this concept for two of the indicators. Although there is a clear difference in the mean values between baseline and treatment, the relatively widely dispersed distributions and high standard deviation values suggest that the impact of the service is still uncertain.
In order to have more robust and meaningful evaluation results, a larger data sample and a more in-depth analysis of the data (e.g. filtering events by certain criteria, taking into consideration peak/off-peak traffic conditions, different user groups, checking for incomplete events or errors in the log data etc.) is required. For further details on this please consult <add link to D6.4 (when it will be published)>.
You can download the evaluation data here.
SVW in Bordeaux
Bordeaux has a lot of traffic light intersections which are used daily by a high number of drivers, causing congestion and pollution. SVW was deployed on around 600 intersection in order to have the best possible impact. The following results describe the SVW analysis on the 5 most used intersections in Bordeaux.
Sample Data Description
The SVW is deployed simultaneously to the GLOSA and uses the same messages and log items (tlmaction, tlmevent and CAM log files). All of these log files are automatically recorded by the PID of the user. The tlmevent logs contain the basic information for each event (e.g. timestamp, log_stationid, intersectionid etc.). The tlmaction logs contain the status of the HMI and thus record the information that was presented to the driver at each moment in time with a frequency of approximately 1Hz. Relevant fields include the current and next signal phase and the distance to the stop line. The CAM logging is mainly used to derive the vehicle position, speed and acceleration for the entire duration of the event, also at a frequency of approximately 1Hz. For a more in-depth description of the logging format and the data fields in each log type please visit Open Common Log Data Format.
If a signal violation warning is shown to the user, it is logged in the tlmaction files using the eventmodelid == 10 and eventactionid == 1 or 2 or 3, depending on the imminence of the signal violation. The implementation of the service in the NeoGLS app is done in such a way that the service is only active in treatment mode, meaning that imminent signal violations are not considered (and logged accordingly) in baseline mode. Since this is a critical safety service, switching the service off for additional treatment events for evaluation purposes was deemed unfeasible, which is why there are no baseline logs in the data collected and an impact assessment on the basis of a baseline/treatment comparison is not possible for SVW.
To simplify the provision and processing of data, all tlmaction logs are grouped into one tlmaction.csv file, all tlmevent logs into one tlmevent.csv file and all CAM logs into one CAM.csv file.
You can download the log data here.
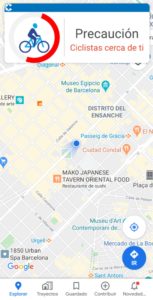
WSP in Barcelona
The number of bicycles and scooters in Barcelona is growing and accidents involving them are increasing. Many of those happen in intersections with low visibility. The Warning System for Pedestrians and VRUs alerts car (or larger vehicle) users to the presence of VRUs in such dangerous scenarios.
Sample Data Description
For the evaluation of the WSP service deployment in Barcelona, the relevant log items are the denmaction, denmevent and CAM log files. All of these log files are automatically recorded by the PID of the user. The denmevent logs contain the basic information for each event (e.g. timestamp, log_stationid, eventcausecode etc.). The denmaction logs contain the status of the HMI and thus record the information that was presented to the driver at each moment in time with a frequency of approximately 1Hz. The following fields are particularly relevant for the RWW service:
- Warningdistance: indicating the distance to the event location
- Servicecategorycode: indicating the message displayed on the HMI
- Pictogramcategorycode: indicating the pictogram displayed on the HMI
The eventcausecode field from the denmevent tables, in combination with the servicecategorycode and pictogramcategorycode fields from the denmaction tables, enables the evaluator to differentiate between the different services using the same message types (DENM). The following combinations of values defines the WSP service deployed in Barcelona:
| Service | DENMevent causecode | DENMaction servicecategorycode | DENMaction pictogramcategorycode |
| WSP | == 97 | == 13 | == 815 |
The CAM logging is mainly used to derive the vehicle position, speed and acceleration for the entire duration of the event, also at a frequency of approximately 1Hz. For a more in-depth description of the logging format and the data fields in each log type please visit Open Common Log Data Format.
The example data set provided here consists of all WSP events logged in Barcelona. The data set includes both baseline and treatment events. ‘Baseline’ indicates that the service was not active (no information was presented to the driver) and is used as a point of reference, whereas ‘treatment’ events are logged when the service is fully functional. Separating events by baseline/treatment is possible by analyzing the content of the denmaction log files and, more specifically, by checking for the existence of rows where eventmodelid==6 (indicating that certain information was displayed on the screen). The Idiada app deployed in Barcelona randomly switches between baseline/treatment with pre-defined probabilities (percentage of baseline events is 25%). Therefore, the example data set provided here consists of roughly 70 valid treatment events and 25 baseline events.
To simplify the provision and processing of data, all denmaction logs are grouped into one iviaction.csv file, all denmevent logs into one ivievent.csv file and all CAM logs into one CAM.csv file. Individual events can be identified through unique combinations of the (log_stationid, eventid) fields. As defined in the log format specification, each event should begin with eventmodelid=5 and eventactionid=1 and end with eventmodelid=5 and eventactionid=3. In case there are multiple instances of these combination for one event, the first (5,1) and (5,3) are used to define the start and end of the event.
You can download the log data here.
Evaluation Results
Several indicators can be used to evaluate the impact of WSP on the traffic flow, mainly in terms of safety. The following table briefly describes some of the main indicators. WSP is expected to decrease the mean speed of the vehicles. Furthermore, it should increase the maximum deceleration (since these are negative values it is a decrease in absolute terms) and decrease the frequency of hard braking, since drivers should be more aware of the vulnerable road users they might encounter.
| Short name | Long name | Unit | Description | Expected effect |
| maxdeceleration | Maximum deceleration | m/s2 | The maximum deceleration (in m/s2) with which the vehicle is breaking during the event. | increase |
| ishardbraking | Hard braking | bool | Bool variable indicating whether there is any deceleration greater than 3 m/s2 | decrease |
| meanspeed | Mean speed | km/h | Mean speed of the vehicle during the event | decrease |
| maxspeed | Maximum speed | km/h | Maximum speed of the vehicle during the event | decrease |
| initialspeed | Initial speed | km/h | Spot speed of the vehicle at the point in time where the event / logging starts | n.a. |
| percspeed_5 | Percentage speed 5s | % | Percentage of the vehicle spot speed at 5s after the first HMI notification compared to initial speed | decrease |
| … | … | … | … |
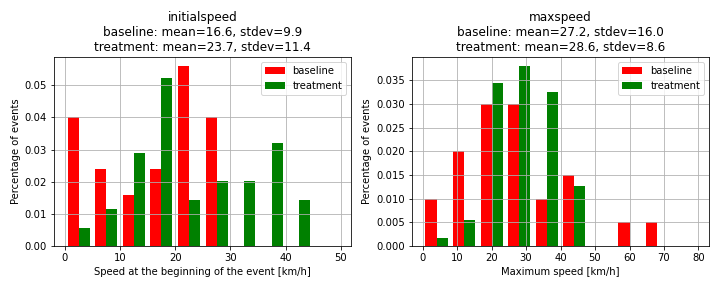
The evaluation results data set provided here also contains a table with the above-mentioned indicators calculated for each event. The overall impact of WSP can then be calculated by grouping events by baseline/treatment and comparing the indicator averages over both groups. The following table gives an overview of the main indicators as extracted from the sample data. Since the overall number of events considered is low, the results are not statistically significant. Maximum deceleration values seem to decrease slightly when using the service. The mean speed also increases, but this might be a direct consequence of the initial speed also being higher in treatment. The percentage speed 5 seconds after the first HMI notification is lower in treatment (but still higher than 1, indicating acceleration rather than braking), showing that drivers react positively to the message being shown.
| Indicator | Baseline mean (n=25) | Treatment mean (n=69) | Percentage difference |
| maxdeceleration | –0.50 | –0.61 | –21% |
| ishardbraking | 0 | 0.01 | inf |
| meanspeed | 20.26 | 23.76 | +17% |
| maxspeed | 27.22 | 28.59 | +5% |
| initialspeed | 16.58 | 23.75 | +43% |
| Percspeed_5 | 1.36 | 1.02 | –25% |
| … | … | … |
To better understand and evaluate these indicators, the mean values are not enough. The probability density functions (PDF) of the indicators for baseline and treatment should also be considered. The following figure illustrates this concept for two of the indicators. Although there is a clear difference in the mean values between baseline and treatment, the relatively widely dispersed distributions and high standard deviation values suggest that the impact of the service is still uncertain.
In order to have more robust and meaningful evaluation results, a larger data sample and a more in-depth analysis of the data (e.g. filtering events by certain criteria, taking into consideration peak/off-peak traffic conditions, checking for incomplete events or errors in the log data etc.) is required. For further details on this please consult <add link to D6.4 (when it will be published)>.
You can download the evaluation data here.